Since 2010, the number of serious road injuries by transport mode has been hard to determine due to poor registration in BRON (see How is the number of serious road injuries in the Netherlands determined?). The casualty characteristics based on LBZ appear to be a reasonable alternative. LBZ contains no information about the crash opponent, only whether the crash did or did not involve a motor vehicle.
In the hospital discharge register LBZ, cyclists are by far the largest group among serious road injuries (see Figure 2). In 2022, 70% (about 5,500) of the serious road injuries in the hospital registration were cyclists. In comparison: in 2022, about four out of ten road deaths were cyclists and the number of cyclists among road deaths has been the largest group for a number of years now (see SWOV fact sheet Road deaths in the Netherlands).
The share of cyclists among serious road injuries in the hospital registration has increased over time (not shown). In 2014, it was 66% (about 3,700), while by 2022, it is estimated that at least 19% of seriously injured cyclists were the result of a crash involving a pedelec; in 2015 (the first year for which we can currently determine pedelec involvement) it was at least 4%.
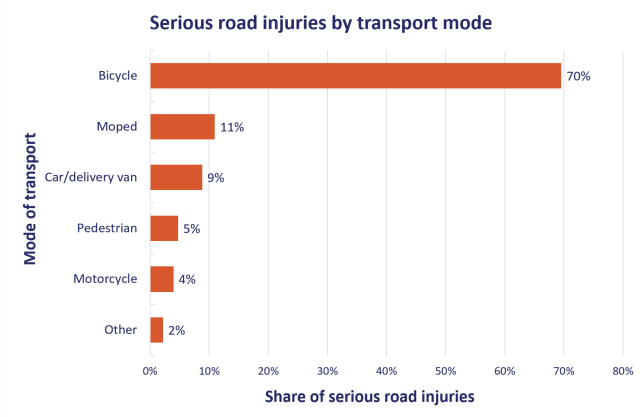
In 2022, 61% (about 5,100) of the serious road injuries were injured in a crash not involving a motor vehicle. Among hospital-registered seriously injured cyclists the share amounted to 82%. In particular, these are cyclists injured in a single-bicycle crash (with no crash opponent), a bicycle-bicycle crash, or a bicycle-pedestrian crash.
The risk of being seriously injured (serious road injuries per distance travelled) is highest for two-wheelers (motorised or non-motorised). For car occupants, the risk is lowest (Figure 3). Figure 3 provides the average biannual risk, because risks calculated on an annual basis, particularly for motorised two-wheelers, fluctuate too much due to uncertainties in mobility data and casualty numbers.[i]
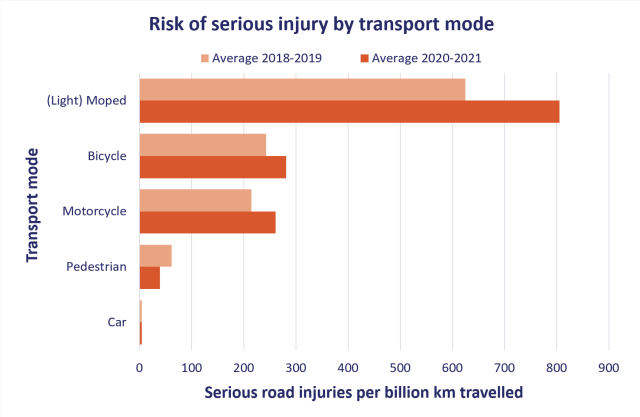
Figure 3. The risk of being seriously injured (number of serious road injuries per distance travelled) in the Netherlands for different transport modes, averaged over 2018-2019 and 2020-2021 based on LBZ. Sources: Statistics Netherlands, DHD and SWOV.
[i] Because of a change in method between 2017 and 2018 and the mobility restrictions associated with the COVID-19 measures in the years 2020-2021, we keep using these two-year averages. Once the 2023 road deaths are known, we will add the years 2022 and 2023.