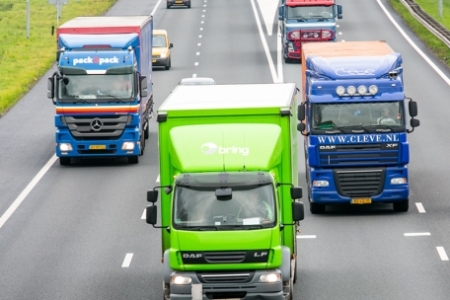
Figure 2 shows that the fatality rate for crash opponents of trucks is 7.5 times higher than for crash opponents of cars and 3.6 times higher for crash opponents of delivery vans. Furthermore, the fatality rate of crash opponents of delivery vans is 2.1 times higher compared to cars. Below we describe how these figures were calculated.

Figure 2. The fatality rate (average over 2009-2018) is defined as the number of deaths among occupants and among crash opponents per billion kilometres travelled by trucks, delivery vans and cars. In the calculation of the fatality rate, the motorvehicle kilometres travelled by the crash opponent were not taken into account (BRON- IenW; Statistics Netherlands - CBS, 2019). Note that the risk calculations are based on preliminary numbers of kilometres travelled in 2017 and 2018.
In the Netherlands, there are over six times as many delivery vans as there are trucks (see Table 1 below the question How many trucks and delivery vans are there in the Netherlands and how many kilometres do they travel on public roads?). Table 2 (see the question What is the annual number of casualties of crashes with trucks and delivery vans?), however, shows that the fatalities among crash opponents of trucks outnumber those of delivery vans. One of the causes is that trucks travel more kilometres per vehicle. Furthermore, more foreign trucks than foreign delivery vans travel Dutch roads. Consequently, the number of kilometres travelled by delivery vans is only 2.4 times higher than that travelled by trucks and tractors. Therefore, we use the number of road deaths per billion kilometres travelled by domestic and foreign trucks or delivery vans in the Netherlands to measure the fatality rate, instead of the number of road deaths per billion vehicles. Figure 2 shows these fatality rates for the crash opponents of trucks and delivery vans, compared to the fatality rate of crash opponents of cars.
