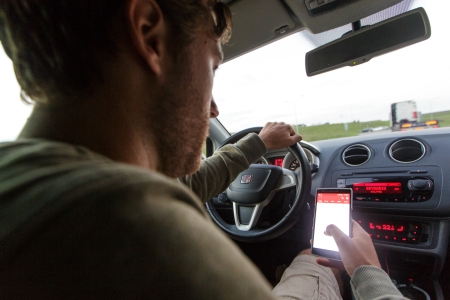
Some distracting activities seem to increase the risk of being involved in a road crash, especially the risk of rear-end collisions [15]. American Naturalistic Driving (ND) research shows that activities causing visual distraction increase crash risk, entering a telephone number for example, typing or reading text messages (see for example [14] [16] [24], but also reaching for objects [25], reading or writing [24] [25] and prolonged glances to objects outside the car [14]. Crash risk is higher when drivers are engaged in more than one distracting activity compared to engagement in only one distracting activity [15].
Table 2 presents the risks (the so-called odds ratios) and the percentage of time (prevalence) drivers are engaged in all kinds of distracting activities, as calculated on the basis of the most recent and large-scale American ND study [16]. What is important about this study is that the road crash risk was calculated on the basis of actual road crashes (905 in all) which the participants were involved in, unlike earlier ND studies [24] [25] [26], in which near-crashes were also included. Including near-crashes may, however, bias the results (for more information see [7]). An odds ratio higher than 1 means that an activity involves a higher risk than non-distracted driving does, whereas an odds ratio lower than 1 points to a lower risk. An odds ratio of 2.5 for the activity ‘browsing/typing, reading or sending text messages/entering a phone number’ in Table 2 means that the risk of a road crash is 2.5 times higher than when the driver is not distracted. The odds ratio is an estimate. The confidence interval of 95%, presented behind the odds ratio, indicates that it is at least 95% certain that the crash risk of ‘browsing/typing, reading or sending text messages/entering a phone number’ was larger than 1.7 (the first number) and smaller than 3.9 (the second number). In Table 2, the odds ratios that diverge from 1 in a statistically significant way are shown in bold type. Figures that are not in bold type signify that the activity was not shown to increase risk, nor to reduce risk. A prevalence of 12.2% for the activity ’talking to passengers’ signifies that drivers talk to passengers for an average of 12.2% of their time behind the wheel. Age also proves to be relevant. When distracted, young drivers have a higher crash risk than middle-aged drivers [27] [28].
|
|
|
Odds Ratio (95% confidence interval) |
Prevalence |
|
Activity with a mobile phone (not defined whether it was a smartphone) |
Browsing on phone (for example finding a contact, searching on the internet)/typing, sending and reading text messages/entering a phone number. |
2,56 (1,68-3,88) |
1,8% |
|
Holding a phone |
2,05 (1,13-3,73) |
1,1% |
|
|
Talking on a handheld cell phone |
1,27 (0,79-2,04) |
2,7% |
|
|
Talking on a handsfree cell phone |
0,40 (0,10-1,63) |
0,9% |
|
|
Activity not phone-related |
Talking to passengers |
1,3 (0,79-2,04) |
12,2% |
|
Talking/singing along |
1,44 (0,99-2,08) |
4,25% |
|
|
Adjusting the radio |
1,57 (0,85-2,91) |
1,3% |
Table 2. The odds ratios and prevalence of several activities distracting drivers [16]. The data for these calculations were collected between 2010 and 2013. The odds ratios that diverge from 1 in a statistically significant way are shown in bold type. The figures are higher than 1, which signifies a risk increase compared to undistracted driving. The odds ratios that are not in bold type represent neither a risk increase, nor a risk reduction.
Table 2 shows that having a phone conversation, both handheld and handsfree, did not significantly increase risk - the 95% confidence intervals do not exceed 1. This finding corresponds to earlier ND studies [24] [25] [26]. It is a remarkable finding, since simulator studies prove, conversely, that having a phone conversation does impair driving behaviour (see the question How does distraction affect driver behaviour?). ‘Self-regulation’ is one of the possible explanations why driving behaviour deterioration, as found in driving simulator studies, does not result in a crash risk increase, as found in ND studies (see for example [29]). In actual traffic, the driving context may determine a driver’s decision whether and when they will have a phone conversation. When drivers are observed in actual traffic (as is the case in the ND study), they do indeed prove to be more inclined to use their phones in less demanding traffic situations, such as waiting at traffic lights, than in complex traffic situations [17]. Driving simulator studies usually leave no scope for this kind of self-regulation. In these studies, drivers are usually told to perform a certain mobile phone task at a given moment.
