Speed and speed management

Updated

If the average speed on a road increases, crash risk also increases, as does the risk of a serious outcome. This is true in general terms, but more so when motorised vehicles crash with unprotected road users, such as pedestrians, cyclists and (light) moped riders. Furthermore, speed differences between vehicles at any one time or place are related to a higher crash risk. Drivers that maintain a speed that is higher than the average speed on that road run a higher crash risk; drivers that maintain a speed that is lower than average do not. Drivers often exceed speed limits, for example because they are in hurry, or they enjoy speeding, or go with the flow, or because they do not notice their speed. In general, we assume that almost one third of fatal crashes involves speeding or driving at a speed that is not appropriate to the circumstances.

Speed management consists of several steps, of which determining a safe limit is the first step. Which limit is safe, depends on the road function, traffic mix, and road layout. Always and everywhere, the limit should be credible (logical) and apparent. It can be supported by physical speed reduction measures, such as speed humps, and by traffic enforcement. Physical speed reduction measures greatly affect speed at location level. Intelligent Speed Assistance (ISA) greatly affects driving speed and therefore road safety, an intervening ISA system (which prevents the vehicle from exceeding the speed limit) being more effective than an advisory ISA system. On the main road network, Variable Message signs or Dynamic Lane Control Signs with dynamic speed limits contribute to more homogeneous speeds, fewer abrupt braking manoeuvres, and fewer crashes or near miss crashes. The effects of less stringent measures, such as educational measures or rehabilitation courses, publicity campaigns, community projects and nudging are often minor and short-term.

Why are high speeds dangerous?

In case of a crash, higher speed results in greater impact, which increases the risk of serious injury [1] [2] [3] [4]. Moreover, at higher speeds, the braking distance is longer, there is less time to process and react to information [2] and, consequently, less opportunity to prevent a crash. Finally, at higher speeds, there is a large amount of information drivers have to process in a short time. If too much information is provided, they more or less automatically focus on information in their central field of vision. This focus is detrimental to observation and processing of information in their peripheral field of vision [5] [6]. Driving fast is sometimes supposed to benefit road safety, since it will make driving less boring and will (thus) increase alertness. However, there is no scientific proof for this supposition. At any rate, the net effect of higher speeds on road safety is negative (see the question Does driving speed affect alertness?).

In all, this implies that when the average speed on a road increases, crash risk also increases as does the risk of a serious outcome (see the question How does speed affect road safety?).

Absolute speed is not the only thing at issue here; speed differences also affect safety. Speed differences involve more encounters with other road users, more lane changes, and more overtaking manoeuvres (see the question How do speed differences affect road safety?).

How often do people drive too fast?

Drivers often exceed speed limits. In response to the question whether, in the last month, they had driven faster than the speed limit, 68% of Dutch drivers responded they had done so on motorways, 69% on rural roads and 58% on urban roads. The average Dutch driver says to have exceeded the speed limit a few percentage points more often than the average European driver [7].

Observations of Dutch driving speeds confirm this picture: a lot of vehicles drive faster than the posted speed limit.  Figure 1 shows that, on  50, 60 and 70km/h roads, 55% to 60% of the passing vehicles exceed the speed limit; on 80km/h roads this is about 50%, and on 100km/h roads 35% to 40%. The data were collected on non-national roads by NDW, Dutch National Data Bank for Traffic Data, which measured speeds driven at 35 to 50 locations. There are, however, considerable differences between times and locations concerning the extent to which limits are exceeded (Kijk in de Vegte & Hovestad, 2019; in: [8]). Among other things, this is related to traffic volume, credibility of the speed limit (see the question What are credible speed limits?) and the level of enforcement.

Figure 1. The share of vehicles exceeding the speed limit on the secondary road network (Source: Kijk in de Vegte & Hovestad, 2019; in: [8]).

Speeding is not just a Dutch problem. An overview of speeding offences in European countries [9] shows that, in the urban area, 35-75% of the observed speeds exceed the 50km/h limit (data from 15 countries), and 62-90% exceed the 30km/h limit (data from three countries). On rural roads, 18-70% of the observed speeds exceed the 80km/h limit (data from eight countries). On motorways with 120km/h limits, 23-64% exceed this limit (data from eight countries) and, in case of 130km/h limits, 19-23% exceed the limit (data from three countries). 

The information above concerns drivers exceeding speed limits. But ‘speeding’ also concerns inappropriate speeds, i.e. speeds which are unsafe in view of the conditions (weather, traffic volume). This is harder to determine and therefore no data are available about how frequent this kind of ‘speeding’ is.

Why do people drive too fast?

Many drivers regularly exceed speed limits. When asked (Figure 2; [10]), Dutch drivers say they mainly do so because they want to adapt their speed to other traffic, because they are in a hurry, because they enjoy it, or because they do so inadvertently. A few of them indicate they do so out of boredom.

Reasons to comply with speed limits (Figure 3) are: road safety, the mandatory nature of the limits, and the risk of being fined. The environment and fuel costs are clearly less important.

Figure 2. Percentage of Dutch drivers giving these motives for speeding in 2011, by road type [10].

Figure 3. Percentage of Dutch drivers giving these motives for respecting speed limits in 2011, by road type [10].

About 10% of Dutch drivers indicate they sometimes exceed speed limits inadvertently (Figure 2). There are four situations in which drivers are prone to drive too fast inadvertently [11] [12]:

  1. After prolonged driving at a high speed on motorways for instance, road users underestimate their own speed and drive faster and faster without noticing.
  2. When downshifting from a relatively high speed to a considerably lower speed, road users do not slow down enough. Examples are: when leaving the motorway, entering the urban area, or if a straight road stretch is followed by a series of curves.
  3. When there is only little peripheral information (information about the immediate environment), road users miss reference points to which they can relate their own speed. Examples are: at night, in fog, and on very open roads in a flat landscape.
  4. In high-wheeled cars, such as an SUV or other jeep-like car, speed perception is distorted and speed is underestimated.

In general, driving comfort has increased in the last few decades. Noise and vibration levels at high speeds have strongly decreased. This does not only apply to larger and heavier cars, but also to smaller ones. That is why drivers receive less physical feedback when driving at high speeds. The sense of ‘driving fast’ diminishes, as it were.

How great is the effect of speed on road safety?

In general, if conditions are equal, speed increases go hand in hand with more crashes and casualties; speed reductions with fewer crashes and casualties. Speed reductions or speed increases have the largest effect on the number of road deaths. Such changes have a slightly lesser effect on the number of serious road injuries, and lesser still on the number of slight injuries.

Approximately and on average, the following holds true: if the average speed on a road increases or decreases by 10%, the number of slight injury crashes rises or falls by 20%, the number of serious injury crashes by 30%, and the number of fatal crashes by 40%. This is a theoretical average based on kinetic laws [1]. As a formula, it looks like this:

Put into words: the ratio between the number of crashes before and after a change in speed equals the ratio between the average speed before and after that change to the power of x. Based on kinetic laws, for slight injury crashes this implies a power of 2, for serious injury crashes a power of 3 and for fatal crashes a power of 4.

Based on data of a large number of empirical studies into the effect of speed changes on crashes and also on a Power model, the exponents for different road types have been estimated [3]. This results in a ‘best estimate’ of the exponent. As can be seen in Table 1, the best exponent estimate for the number of road deaths is 4.6. To be 95% certain about the values the true effect lies between, we apply the formula twice, using the two bracketed exponents in the column headed 95% confidence interval – in this example, therefore, 4.0 and 5.2.

Crash/injury severity

Rural roads

Urban roads

Best estimate

Interval 95% confidence 

Best estimate

Interval 95% confidence

Road deaths

4.6

(4.0 – 5.2)

3.0

(-0.5 – 6.5)

Fatal crashes

4.1

(2.9 - 5.3)

2.6

(0.3 - 4.9)

Serious injuries

3.5

(0.5 - 5.5)

2.0

(0.8 - 3.2)

Serious injury crashes 

2.6

(-2.7 - 7.9)

1.5

(0.9 - 2.1)

Sight injuries

1.4

(0.5 - 2.3)

1.1

(0.9 - 1.3)

Slight injury crashes

1.1

(0.0 - 2.2)

1.0

(0.6 - 1.4)

Table 1. Exponents in the formulas for the correlation between speed and crashes/casualties with different injury severity [3]

Re-analysis of the data [4] [13] shows that the exact correlation between speed and crash risk depends on the initial speed and can therefore be better described with an exponential model than with a Power model. Thus, a 10% reduction of average speed has a smaller effect when it concerns a reduction from 50 to 45 km/h than when it concerns a reduction from 100 to 90 km/h. In absolute terms, a speed reduction of e.g. 10 km/h will lead to a similar decrease of the number of crashes, independent of the initial speed [14].

There are no indications that the correlation between speed and road safety is less strong for newer cars, which are equipped with more systems to avoid crashes and which offer better protection to their occupants [15].

How do speed differences affect road safety?

Road safety is not only affected by average speed, but also by speed differences. This may be considered in two different ways: at the level of the individual driver (is crash risk higher for a driver whose speed is higher or lower than the average speed on that road?), and at road level (are there more crashes on roads with greater speed differences?) [2] [14].

Individual level

Vehicles that drive at a speed that is higher than average on that road, run a higher crash risk; vehicles that drive at a lower than average speed do not run a higher or lower risk. Older studies [16]) for example) often found that risk increased for vehicles driving at both a higher and a lower than average speed. In these studies, however, cars manoeuvring at a low speed were also included, and in those cases it was probably the manoeuvring that increased the risk and not the low speed. More recent studies that exclude this type of crash, only find an increased crash risk for vehicles driving at a higher speed and not for vehicles driving at a lower speed [17] [18] [19] [20].

Road level

Greater speed differences between vehicles at road level, i.e. at the same time and place, are linked to a higher crash risk. It is impossible to quantify this link. The results of different studies and their research methods are too divergent to conduct a sound meta-analysis. Elvik concluded as much on the basis of 13 studies of the link between speed differences and crash risk, using loop detector data (Elvik, 2014; in: [14]).

Does driving speed affect alertness?

It is sometimes claimed that a lower speed (limit) adversely affects alertness and, thus, road safety. We are, however, not aware of any studies that have researched this. What we do know is that having too few or too simple tasks for an extended length of time (when work load is too low) may lead to fatigue which adversely affects road safety (see SWOV fact sheet Fatigue). In addition, changing driving speed proves to have a positive effect on alertness [21]. Yet, all research points out that lower speed has a positive net effect on road safety: if average speed on a particular road is reduced, the number of crashes decreases (see the question How great is the effect of speed on road safety?).

How many crashes are caused by (too) high speeds?

Internationally, it is generally assumed that about one third of fatal crashes are partly due to speeding or to inappropriate speeds (see [9] [12]) for instance). Yet, it is hard to determine precisely whether (a too) high speed is the main cause since, apart from speed, there are other factors that may lead to a crash. It is particularly hard to determine objectively whether a certain speed was too high under the prevailing circumstances.

Is speeding equally dangerous everywhere?

Speeding is not equally dangerous everywhere. What is true, anywhere and anytime, is that the number of crashes and their severity increase when average speed increases (if other conditions remain the same) [2] [3] [4] [15] (see the question How great is the effect of speed on road safety?). However, the exact relationship between crashes and speed on a particular road depends on a great many factors, among which infrastructural characteristics, traffic volume and traffic mix.

Is speeding equally unsafe for all road users?

Equal (impact) speed does not have equal consequences for all road users. The consequences mainly depend on the mass of the colliding vehicles and the extent to which the crash opponents are protected and vulnerable.

Mass

In a collision, difference in mass determines which vehicle absorbs which part of the energy released. The occupants of the lighter vehicle are worse off than those of the heavier vehicle. Mass differences are evident in the case of trucks colliding with cars, but there are also considerable mass differences between cars. The difference between a large SUV and a small city car may easily amount to a factor up to 3.

Protection

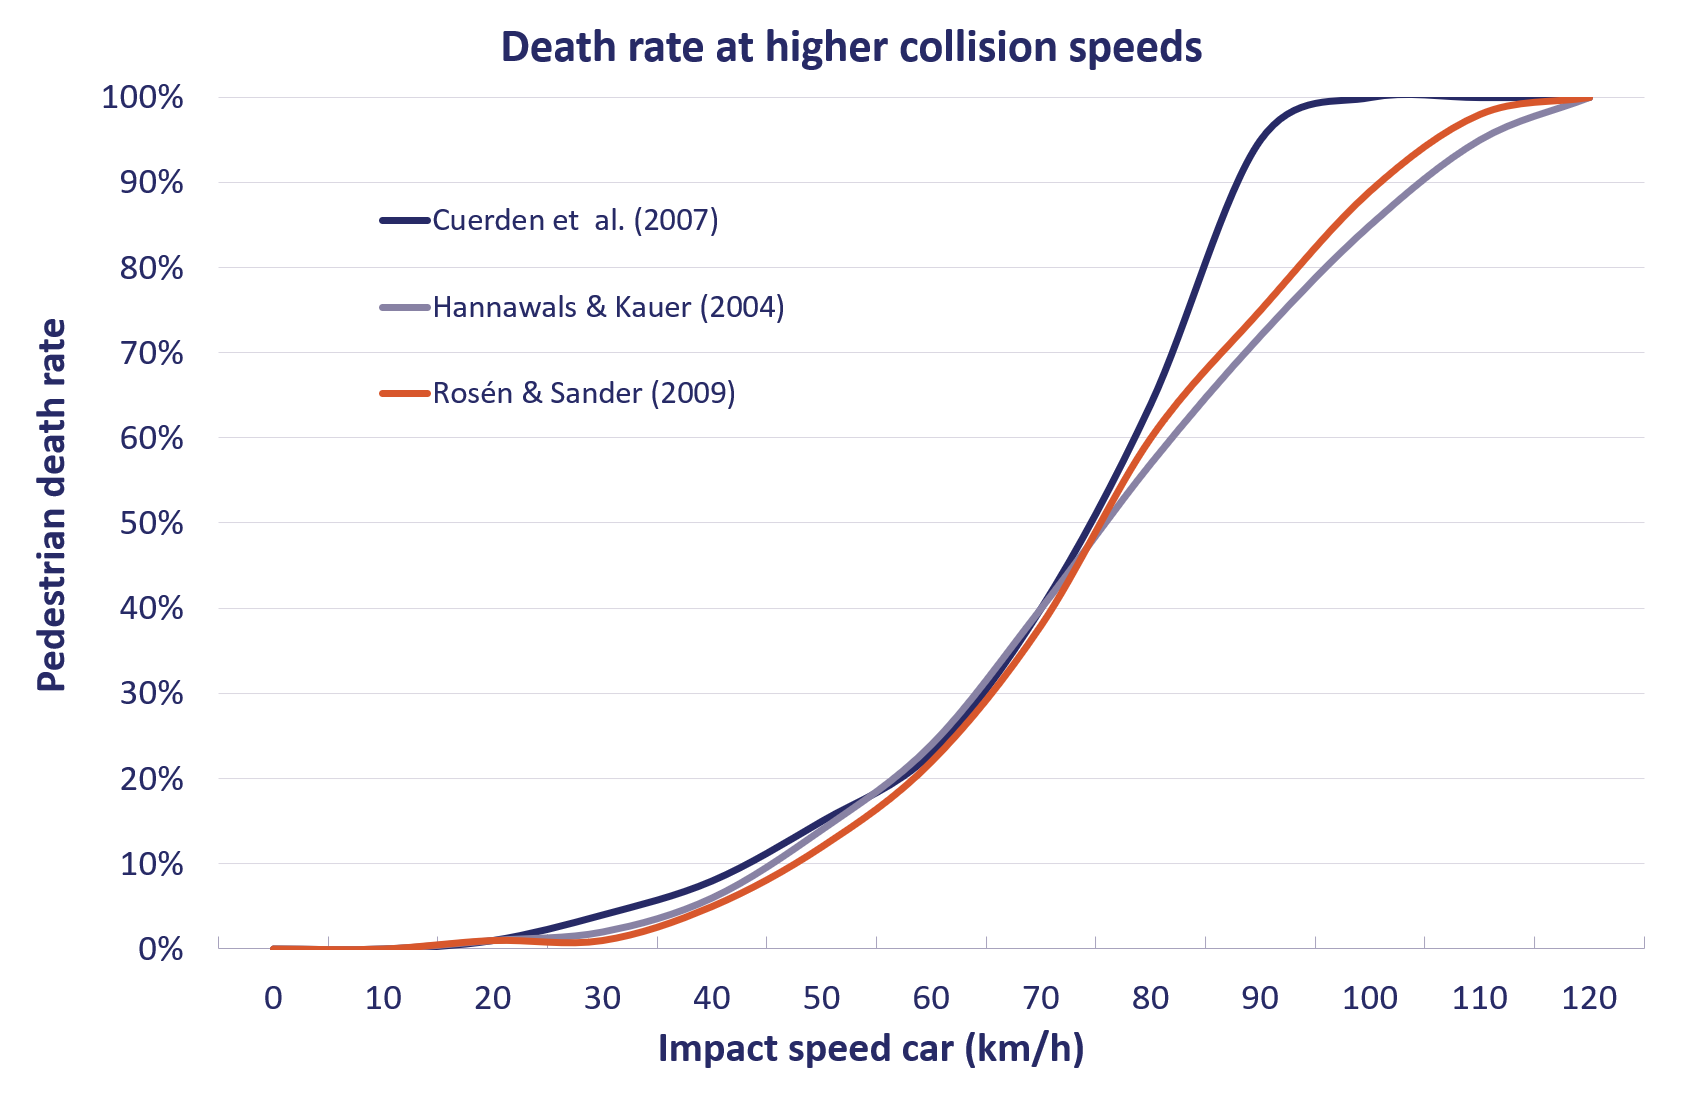
Mass differences in a collision between a motor vehicle and an unprotected and therefore vulnerable moped rider, cyclist or pedestrian are of an entirely different order. In that case, mass differences from a factor of 10 (a very light small car) to almost 700 (trucks weighing 50 tons) are involved. For vulnerable road users, chances of survival decrease dramatically as (impact) speed increases (Figure 4). An overview of several studies [22] shows that, in a collision with a car, more than 95% of pedestrians survive at an impact speed of 30 km/h; 85% survive at an impact speed of 50 km/h, about 40% at an impact speed of 80 km/h, and only a few at an impact speed of 100 km/h.

Figure 4. The relationship between impact speed and pedestrian death rate in a collision with a passenger car (Source: [22] ).

Vulnerability

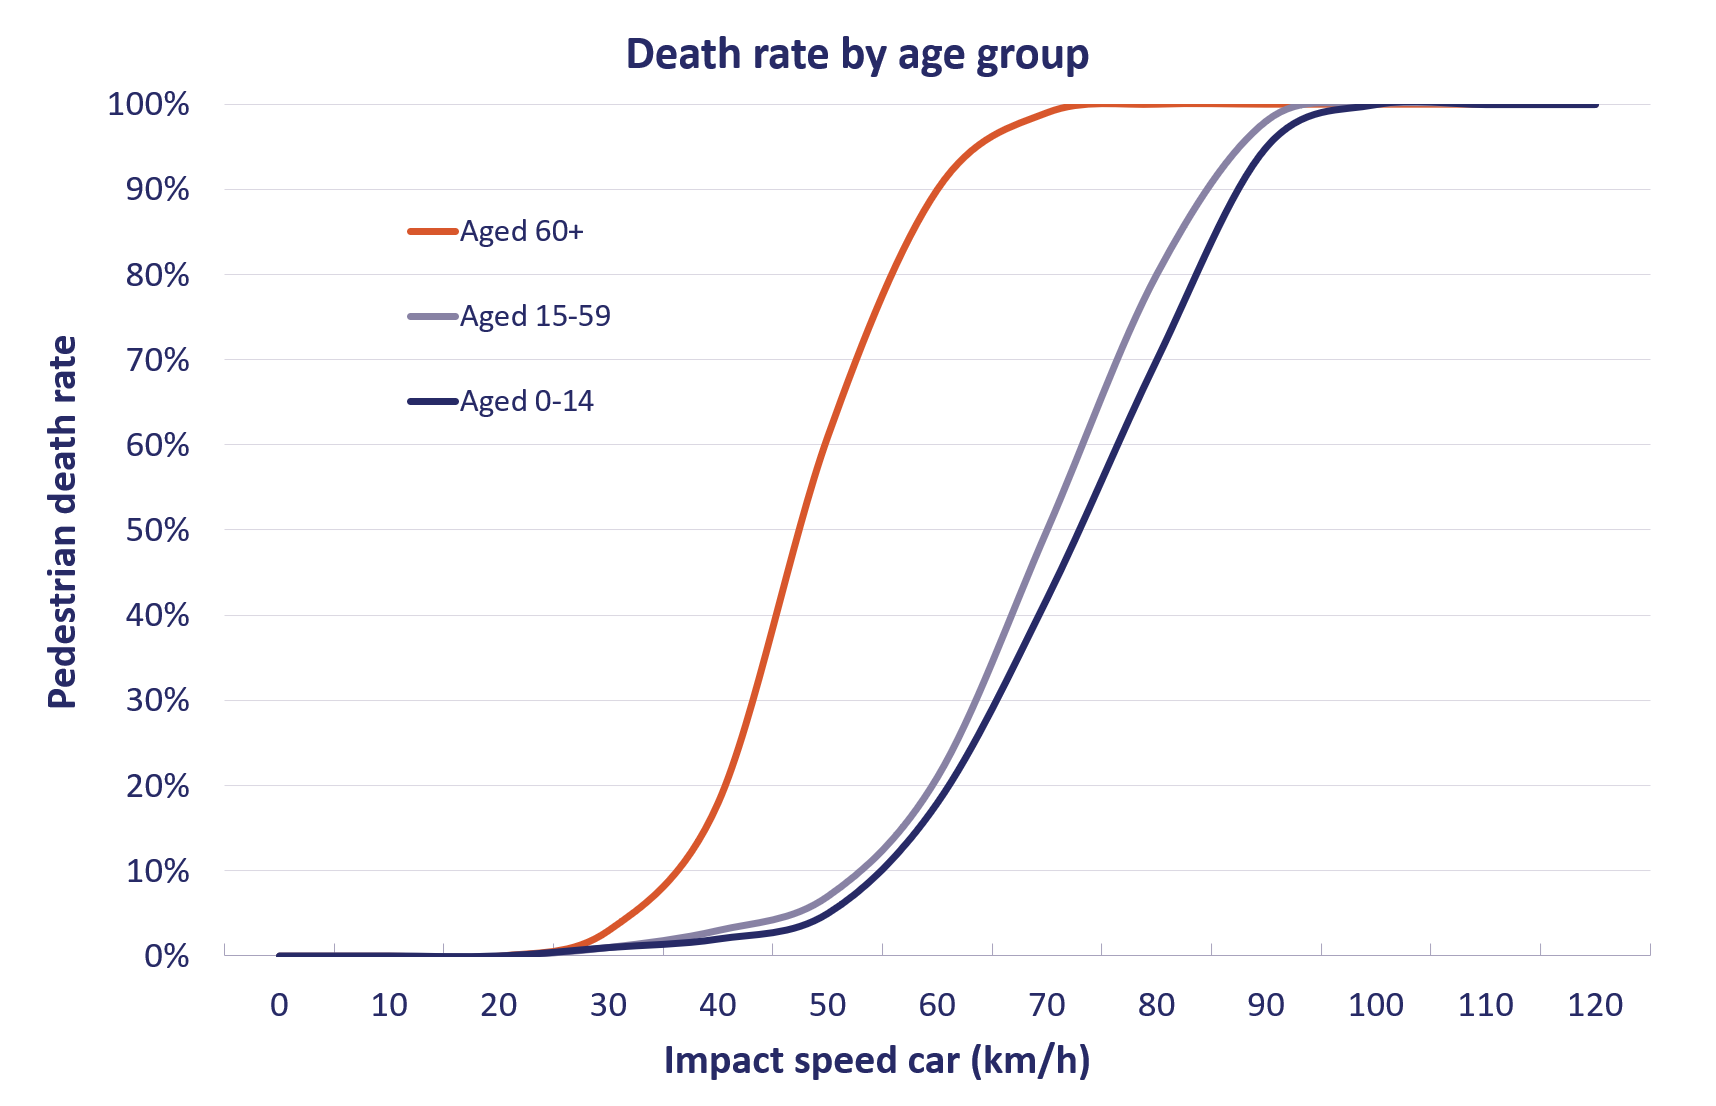
Older road users are physically more vulnerable than younger road users. If impact speed is equal, they have a significantly smaller chance of surviving a collision (see Figure 5; Davis, 2001; in [22] ).

Figure 5. The relationship between impact speed and pedestrian death rate for different age groups when colliding with a passenger car (Davis, 2001; in [22] ).

What are the speed limits in the Netherlands?

In the Netherlands, for urban and rural roads, the general speed limits are 50 and 80 km/h respectively. At the end of the nineties, the speed limit for many residential areas was lowered to 30 km/h, and for rural areas to 60 km/h. The roads in question are roads on which fast traffic and vulnerable road users mix, and for which the low(er) limit was set to ensure safety (see also SWOV fact sheet Sustainable Road Safety). Some rural through-roads have a 100km/h limit (trunk roads); these are roads with a connecting function, either interregionally or nationally.

The general limit on motorways is 130 km/h. In addition, there are other time- and place-dependent limits of 80, 100 and 120 km/h. Since March 2020, the daytime (06:00-19:00 h) limit has been restricted to 100 km/h for all motorways.

There are some other limits (70 km/h and 90 km/h), but these apply far less often.

In late 2020, Parliament adopted a motion to apply 30 km/h as the guiding principle for urban areas, leaving the opportunity to have through-roads deviate from this principle when safe. To this effect, CROW, SWOV and the municipalities are working on an assessment framework.

Is there a minimum speed as well?

For vehicles, there are no legal minimum speeds. To be allowed to drive on a trunk road, a vehicle must be able to drive at a minimum speed of 50 km/h, and 60 km/h on motorways. This refers to the construction speed. Someone who hinders or endangers other traffic may be fined on those grounds (Article 5 of the 1994 Dutch Traffic Code).

How to recognise the prevailing speed limit?

General limits

Drivers in the Netherlands need to know the general limits in the urban and rural areas and to comply with them. Explicit limit signs are not required; they may be deduced from other signs, such as those marking the boundaries of the urban area (H01/H02), start or end of the trunk road (G03/G04) or motorway (G01/G02). By special lines and markings (essential recognisability characteristics), information about road type and the associated required (speed) behaviour can be supported ([23]; see SWOV fact sheet Principles for safe road design).

Start/end of urban area:
(H01/H02)

Start/end of trunk road:
(G03/G04)

Start/end of motorway:
(G01/G02)

Figure 6. Road signs from which speed information is to be deduced (Source: verkeersbordenoverzicht.nl)
 

Other limits

Other speed limits are indicated by signs along the road (start: A01; end: A02) or above the road. If the limit is time-varying, this is indicated by a supplementary plate below the speed limit sign. Sometimes, information about speed limits is also indicated by hectometre signs (BB07) and, increasingly, in cars, generally by means of a navigation system. The limit indicated by the navigation system is, by far, not always correct and (therefore) not legally valid.

Advisory speeds

Apart from signs indicating formal maximum speed, there are also signs indicating advisory speeds (A04) and end of advisory speeds (A05). These are local signs, for example for indicating a dangerous curve or other road danger. These signs advise road users and do not impose obligation.

Limit signs:
(A01 en A02 series)

Hectometre signs:
(BB07)


Advisory speeds:
(A04 and A05 series)

Figure 7. Examples of speed limit signs and advisory signs (Source: verkeersbordenoverzicht.nl)
How are speed limits determined?

Authorised by law (see the question What are the speed limits in the Netherlands?) Dutch road authorities will determine the speed limit for a particular road. In the Netherlands, the speed limit largely depends on the road category [23]. In addition, a combination of safety, accessibility, flow and environment contributes to the limit chosen. If road safety were the only determinant, limits would be considerably lower (see the question What are safe speeds?).

What are safe speeds?

Safety is an important criterion for determining speed limits. Which speed is safe depends on the road function – and consequently – on the traffic mix and the nature of possible conflicts. Among other things, the Sustainable Safety principle (Bio)mechanics ([24]; see SWOV fact sheet Sustainable Road Safety) implies that traffic flows that use the same space should differ in speed, direction, and mass as little as possible. If differences in direction (at intersections for instance) and mass (for example when motorised traffic and pedestrians interact) do occur, driving speed should be low to realise sufficient safety. The so-called stopping sight distance, i.e. the distance required to observe and recognise an object on the road, and to make the vehicle stop on time, also determines which speed is safe, as does the safety of the verges.

These general principles have resulted in an overview of safe speeds for different circumstances (Table 2).


Potential conflicts and requirements associated with

Safe speed (km/h)

Possible conflicts with vulnerable road users in home zones 

(no foot paths and pedestrians using the carriageway)

15


Possible conflicts with vulnerable road users on roads and at intersections, including situations with bike lanes or advisory bike lanes

30 

No conflicts with vulnerable road users, except with helmet-protected riders of motorised two-wheelers (mopeds on the carriageway). Possible right-angle conflicts between motorised vehicles, possible frontal conflicts between motorised vehicles. Stopping sight distance ≥ 47 m

50 

No conflicts with vulnerable road users 

No right-angle conflicts between motorised vehicles, possible frontal conflicts between motorised vehicles

Obstacles shielded or obstacle-free zone ≥ 2.5 m, (semi)hard shoulder

Stopping sight distance ≥ 64 m

60 

No conflicts with vulnerable road users 

No right-angle conflicts between motorised vehicles, possible frontal conflicts between motorised vehicles

Obstacles shielded or obstacle-free zone ≥ 4.5 m, (semi)hard shoulder

Stopping sight distance ≥ 82 m

70 

No conflicts with vulnerable road users 

No right-angle or frontal conflicts between motorised vehicles

Obstacles shielded or obstacle-free zone ≥ 6 m, (semi)hard shoulder

Stopping sight distance ≥ 105 m

80 

No conflicts with vulnerable road users

No right-angle or frontal conflicts between motorised vehicles

Obstacles shielded or obstacle-free zone ≥ 10 m, hard shoulder 

Stopping sight distance ≥ 170 m

100 

No conflicts with vulnerable road users

No right-angle or frontal conflicts between motorised vehicles

Obstacles shielded or obstacle-free zone ≥ 13 m, hard shoulder 

Stopping sight distance ≥ 260 m

120 

No conflicts with vulnerable road users

No right-angle or frontal conflicts between motorised vehicles

Obstacles shielded or obstacle-free zone ≥ 14.5 m, hard shoulder

Stopping sight distance ≥ 315 m

130 

Table 2. Elaboration of ‘safe speed limits’. Differences with the row above are indicated in bold (Source: SWOV fact sheet Sustainable Road Safety).

What are credible speed limits?

Credible speed limits are limits that meet the expectations raised by the road and the road environment, so that drivers are more inclined to comply with them [25]. In other words, credible speed limits are felt to be logical. Thus, it would mostly be rather incredible to lower the limit of an 80km/h or a 50km/h road to 60 and 30 km/h respectively by merely changing the speed limit signs without adapting the road. In most cases, the lower limits should be supported by adapting the road or the road environment. Table 3 shows a few characteristics affecting the credibility of a speed limit, since they automatically invite driving at a higher or lower speed. Explaining why a limit does not match the appearance of the road may help improve credibility (for instance ‘Noise pollution’ or ‘School area’)

Obviously, road safety will always be the guiding principle: first determine what safe speed limit a road requires (see the question What are safe speeds?), and subsequently ensure that the limit is credible.

Road characteristic

Effect of driving speed

Number of lanes

More lanes → higher speed

Road/lane width 

Wider roads/lanes → higher speed

Median 

Median present → higher speed 

Hard shoulder

Hard shoulder present → higher speed

Longitudinal marking 

Edge and centre line marking → higher speed

Road surface 

Smooth road surface (asphalt) → higher speed

Open environment

Open environment → higher speed

Table 3. Road and road environment characteristics that imperceptibly affect driving speed (Source: [26]).

What steps does speed management consist of?

Speed management, intended to realise safe driving speeds, consists of a combination of measures that have to be implemented in a logical order [25] [27] [28]:


Step 1: Determine what speed limit is safe
What speed is safe (Table 1 in the question How great is the effect of speed on road safety?) mainly depends on traffic mix and conflict types: does heavy motorised traffic have to mix with much lighter and unprotected road users (pedestrians, (light) moped riders and cyclists), and what kind of conflicts may occur (transverse conflicts, frontal conflicts). The obstacle-free zone and stopping sight also affect safe speeds.


Step 2: Ensure the limit is credible
Credible means that the limit should meet the expectations raised by the appearance of the road, and is thus considered logical, so that drivers are more inclined to comply with the limit. Certain road characteristics (see Table 2 in the question What are safe speeds?) may also make safe limits credible.


Step 3: Provide appropriate information about the local limit
Information about the local speed limit is mostly provided by traffic signs. However, in the Netherlands, general limits are not indicated by traffic signs: road users are supposed to know about them. The speed limit is sometimes also provided by hectometre posts. And increasingly, limits are displayed in the vehicle.


Step 4: Where necessary, deploy physical speed reduction measures
Where necessary (for example near schools, at pedestrian and bicycle crossings, at-grade intersections), physical speed reduction measures help drivers reduce speed: speed humps, road narrowing, raised intersections or roundabouts. The location of the speed reduction measure must be logical and its dimensions must be in line with the intended speed (see [29]) for example).


Step 5: Deploy traffic enforcement as a complementary measure
We may assume that the four previous steps will prevent many speeding offences. But, since drivers will ultimately determine their own speed, speeding offences will always occur. That is why enforcement, focusing on both general deterrence and prevention will still be necessary (see SWOV fact sheet Traffic enforcement). 


Step 6: Support by education and publicity campaigns
In support of the previous steps, education and publicity campaigns can be used to explain deployment of speed reduction measures and enforcement, and make people aware of the risk of driving (too) fast. The main objective is problem awareness and acceptance of the measures. Immediate effects on behaviour are hard to achieve by means of education and publicity campaigns only [30] [31]

Did the increase of the maximum speed to 130 km/h result in more crashes?

In 2019, SWOV studied the effect of the increased general maximum speed on Dutch motorways that had been introduced in 2012 and, since then, adopted at more and more locations. The study [32] showed that the increase to 130 km/h on the relevant road sections resulted in:

  • a small increase of average speed;
  • a somewhat higher V85 (the speed which is exceeded by 15% of the vehicles);
  • a somewhat greater dispersion of speeds;
  • a marked larger difference between speeds on the right and the left lane on roads with more than two lanes; on two-lane roads, speed differences hardly changed.

The exact effect on speed proved to strongly depend on location. The increase in the number of road deaths on motorways in recent years could not be unequivocally attributed to the speed limit increase to 130 km/h. A previous study by engineering consultancy firm Sweco [33] showed that in the five years following the increase (2013-2017), fatal crash rate on roads with a permanent or variable 130km/h limit had increased by 17% more than on roads with unchanged limits. In absolute terms, the numbers were fairly small: an increase of approximately two fatal crashes a year.

Did the reduction of the daytime maximum speed to 100 km/h result in fewer crashes?

Since March 2020, maximum daytime (6 am to 7 pm) speed limit on all motorways in the Netherlands has been 100 km/h. The measure was introduced to help alleviate the nitrogen problem. In theory, a reduction of driving speed will lead to a reduction in casualties. It cannot yet be determined whether this has actually happened. Moreover, the introduction of the speed limit reduction exactly co-incided with the first COVID19 lockdown. That is why the lockdown mobility effects (exposure) cannot be decoupled from the effects of the limit reduction (lower risk).

How much safer will driving in the urban area be when 30 km/h is the standard speed limit?

Reducing the speed limit in a 50km/h area to 30k m/h will considerably benefit road safety. The more actual driving speed drops, the greater the safety effect. A study in the early nineties [34], when the 30km/h zones were introduced at a wider scale in the Netherlands, an average 22% reduction of the number of injury crashes was found. In all, a further roll out of 30km/h zones in the first ten years of Sustainable Safety (1998-2008) resulted in an estimated 51 to 77 fewer road deaths [35].

These kinds of safety effects of a standard speed limit of 30 km/h will only be achieved if it is impossible to exceed this limit in practice. Merely putting up 30km/h signs will not suffice, since a 30km/h limit also needs to be credible (see the question What are credible speed limits?). Introducing a standard 30 km/h will be a challenge for through-roads in particular. It still needs to be determined how these roads can be redesigned as 30km/h roads so that they are safe and will also facilitate traffic flow to a sufficient degree.

How effective are speed cameras and average speed checks?

Speed cameras and average speed checks are both very effective in reducing crashes, but the latter are more effective. A meta-analysis of speed enforcement studies [36], shows that camera enforcement results in a 19% reduction of the total number of crashes and a 21% reduction of the number of serious and fatal crashes. A meta-analysis of average speed check studies [37] shows these checks result in a 30% reduction of the total number of crashes and a 56% reduction of the number of serious and fatal crashes. For more information see SWOV fact sheet Traffic enforcement.

How effective is intelligent speed assistance (ISA)?

Intelligent speed assistance (ISA) leads to lower driving speeds and, therefore, to fewer crashes and casualties (see the question How great is the effect of speed on road safety?). ISA compares driving speed to the local speed limit. Subsequently, the system provides feedback to the driver (informing/warning) or makes speeding physically impossible (intervening).

There is no doubt that ISA can improve road safety. Yet, the effect of ISA on the number of crashes does mainly depend on:

  • The ISA type: an intervening variant is considerably more effective than an advisory variant.
  • Penetration rate: the more vehicles are equipped with ISA, the greater the effect will be.
  • Present speed behaviour: the more frequent and the more serious speeding offences are, the greater the effect of ISA will be.

On the basis of research in the UK [38], it is estimated that full implementation of an intervening ISA will eventually result in a 30% reduction of the number of fatal crashes and a 25% reduction of the number of serious injury crashes. However, estimates of the effect of ISA on the number of crashes greatly differ, as is shown in Table 4. The differences are related to the estimation method used (simulator study or field study; calculated on the basis of the statistical connection between speed and crashes or on the basis of characteristics of actual crashes) and on the included crash types (all crashes or certain crash types – see [39]).

ISA type

Crash type

Studie


ESVC (UK)

LAVIA (F)

ISA-UK (UK)

TAC SafeCar (AUS)

Doecke & Wooley (AUS)

Informing

Fatal

18-24%

4-7%


11%

Serious

14-18%

0-3%


8.3%

Warning

Fatal

19-32%

3-17%

21%

9%

18.4%

Serious

15-25%

1-11%


7%

15.6%

Intervening

Fatal

37-59%

8-16%

46%


28.3%

Serious

29-48%

0-9%


26.5%

Table 4. The studies mentioned in a literature review, and the effect of different ISA types on the number of fatal and serious crashes they report. Source: [39].


ISA also leads to more homogeneous speeds, which, apart from a positive effect on traffic flow, also benefit road safety (see the question How do speed differences affect road safety?). In the late nineties, an ISA pilot in the Dutch city of Tilburg showed the standard speed deviation on 30km/h roads to decrease by 3.5 km/h (from 10.0 to 6.6 km/h) and on 50km/h roads by 2.8 km/h (from 13.4 to 10.6).

Some people are worried that ISA may incline users to drive at the exactly indicated speed and that they will less often adapt their speed to the actual conditions that may demand a speed below the limit (bad weather, heavy traffic). Others are also worried that the mostly lower speed of ISA controlled cars may annoy other drivers, leading to hazardous and undesirable behaviour, such as overtaking, tailgating and road rage. Such implications cannot be ruled out, but, as yet, there is no clear scientific evidence that they actually occur. And even if they do occur for some drivers and in some circumstances, ISA will still have a positive net effect on road safety, as the many ISA evaluation studies show (see for example Table 4).

Almost all studies find ISA to have a positive effect on fuel consumption and emissions, but they differ in the extent of the effect [39].

How effective are speed limiters for repeat offenders?

A Dutch study [40] shows that speed limiters, or an intervening ISA, may be effective as a sanction for serious speed-limit offenders. As long as the systems is activated, average speed is lower, speed is more homogeneous and limits are exceeded less often and to a lesser degree. Yet, as soon as the system is disconnected, the effect will disappear. Furthermore, the participating offenders regularly used the panic button to bypass the system. In the same study, the effect of an advisory ISA was also assessed. The effect on speed, though somewhat smaller, was still positive as long as the system was activated, while it disappeared when the system was de-activated.

How effective are other speeding measures?

Physical speed reduction measures considerably affect driving speed at locations where the measure applies. Dynamic lane control signs with dynamic limits contribute to more homogeneous speeds, fewer intensive braking manoeuvres and fewer crashes and near miss crashes. The effects of softer measures, such as rehabilitation courses, publicity campaigns, community projects and nudging are minor and short-term.

Physical speed reduction measures

Physical speed reduction measures make driving at a (too) high speed physically impossible and are therefore very effective in reducing speed, at any rate near the location of the measure.

Physical speed reduction measures primarily imply speed humps, road narrowing, and axis offsets. A roundabout will automatically ensure a lower speed and may therefore also be considered a physical speed reduction measure. To achieve a maximum effect, the physical speed reduction measures should be implemented at the appropriate location, with appropriate spacing and dimensioning. Speed humps that are too low or too far apart will have little effect on speed. A speed hump at a location where speed is not a problem, will not benefit acceptance of this kind of measure. Dutch guidelines for applying physical speed reduction measures [29] [41] are published by CROW, technology platform for transport, infrastructure and public space.

Speed limits on dynamic lane control signs

Speed limits on dynamic lane control signs lead to more homogeneous speeds, a reduction of the number of crashes and near miss crashes [42] and to fewer intensive braking manoeuvres [43]. Dynamic lane control signs allow for limit reductions should weather and traffic conditions so require and, therefore, have an important signalling effect in case of incidents and deviating conditions. Thus, dynamic lane control signs effectively complement general speed limits and time-varying limits. Dynamic lane control signs should not be used to display the general limit, because this would be detrimental to the aforementioned signalling effect [44] [45].

Speed limits and other relevant information on dynamic lane control signs have mostly been implemented at motorways. The limits they indicate are not advisory speeds, as is sometimes supposed, but legal maximum speeds. If the speed limit on the dynamic signs is different from the general limit or the road sign limit, the lowest speed is mandatory. Dynamic lane control signs  mean to draw the driver’s attention to special conditions that require a lower speed; in particular, in case of congestion or incidents upstream, but also in bad weather conditions, such as slipperiness or fog. Factors affecting compliance with the dynamic speed limits are, among other things, the approach speed and the spacing of consecutive dynamic lane control signs [46].  

Educational measures or rehabilitation courses

In the Netherlands, people having committed one or two serious offences (other than alcohol related offences) can be obliged to participate in a rehabilitation course called ‘Educational Measure Behaviour and Traffic’ (EMBT). However, this rehabilitation course, proves to have little effect on road user behaviour.

In case of serious offences, the Central Office for Motor Vehicle Driver Testing (CBR) may impose a rehabilitation course or ‘educational  measure’ as an administrative penalty. The Dutch EMBT is specifically meant for drivers who have repeatedly displayed undesirable driving behaviour during a single car journey, but the measure may also be imposed for a single very serious speeding offence. An evaluation showed that 30% of the drivers who had completed an EMBT in 2013 became involved with the judicial authorities once again; 20% committed another traffic offence within two years, and 12% were charged with an EMBT related offence within two years [47]. More information about can be found in SWOV fact sheet Traffic enforcement.

Influencing behaviour by publicity campaigns, community projects and nudging

The aforementioned speeding measures may be considered as hard behavioural measures. Softer behavioural measures are aimed at providing general or more targeted information (publicity campaigns and several community projects) that entice the public (nudging). As far as the measures have been evaluated, they appear to have limited time and place effects.

Publicity campaigns

There is little evidence for the effectiveness of publicity campaigns on road safety by making use of mass media only (see SWOV fact sheet Public service advertising). A more personal and local form of publicity is often more effective [48]. This was confirmed by an evaluation of the effect of the Dutch campaign Respect the speed limit [30].

on speeding behaviour in the urban area: in general, no effect was found on driving speed and the number of speeding offences. In areas where the general campaign was supported by motto billboards along the road, a small, albeit temporary, effect on driving speed was found.

Community projects

Particularly in 30km/h areas, community projects may lead to a small, statistically insignificant reduction of driving speed, while they do not have a measurable effect on feelings of unsafety. This was shown by an evaluation of several community projects aimed at speeding by Bax and colleagues [49]. The previous evaluations they described did not show any convincing effects of community projects either. Veilig Verkeer Nederland (Safe Traffic Netherlands) organises and supports community projects to create and increase awareness (of one’s own) behaviour, including speeding behaviour. Examples are a bin sticker campaign, braking distance demonstrations and having people design road signs.

Nudging

Nudging, or automatic influencing of individual behaviour, implies tempting people to display desired behaviour without coercion. Nudging can affect behaviour, but only slightly, and it may not be easy to generalise the possible effects, nor to make them last [50]. Without additional measures, nudging does not appear suitable for realising lasting behavioural changes. An actual application aimed at drivers’ speeding behaviour confirms this general finding. Placing Dick Bruna drawings – that are associated with children – on billboards along 30km/h roads resulted in a reduction of average speed (of 0,75 km/h), of the V85 (of 1,5 km/h), and of the share of offenders (of 5%), a minor effect that, moreover, disappeared within a few weeks [51]. In the European Project MeBeSafe, different forms of nudging were developed and tested in practice. The field study results showed mostly positive effects, but long-term effects were not studied [52].

Publications and sources

Below you will find the list of references that are used in this fact sheet. All sources used can be consulted or retrieved.

[1]. Nilsson, G. (1982). The effects of speed limits on traffic accidents in Sweden. In: Proceedings of the international symposium on the effects of speed limits on traffic accidents and transport energy use. 6-8 October 1981, Dublin. OECD. p. 1-8.

[2]. Aarts, L. & Schagen, I. van (2006). Driving speed and the risk of road crashes: a review. In: Accident Analysis & Prevention, vol. 38, nr. 2, p. 215-224.

[3]. Elvik, R. (2009). The Power Model of the relationship between speed and road safety: update and new analyses. TØI Report 1034/2009. Institute of Transport Economics TØI, Oslo.

[4]. Elvik, R. (2013). A re-parameterisation of the Power Model of the relationship between the speed of traffic and the number of accidents and accident victims. In: Accident Analysis & Prevention, vol. 50, p. 854-860.

[5]. Wickens, C.D. & Horrey, W.J. (2008). Models of attention, distraction, and highway hazard avoidance. In: Regan, M.A., Lee, J.D. & Young, K.L. (red.), Driver distraction: Theory, effects, and mitigation. CRC Press, Taylor & Francis Group, Boca Raton, Florida, p. 57-69.

[6]. Rogers, S.D., Kadar, E.E. & Costall, A. (2005). Gaze patterns in the visual control of straight-road driving and braking as a function of speed and expertise. In: Ecological Psychology, vol. 17, nr. 1, p. 19-38.

[7]. Holocher, S. & Holte, H. (2019). Speeding. ESRA2 Thematic report Nr. 2. ESRA project (E-Survey of Road users’ Attitudes). Federal Highway Research Institute, Bergisch Gladbach, Germany.

[8]. Aarts, L.T., Schepers, J.P., Goldenbeld, C., Decae, R.J., et al. (2020). Achtergronden bij De Staat van de Verkeersveiligheid 2020. De jaarlijkse monitor [Backgrounds of the State of Road Safety 2020. The annual monitor]. R-2020-27A [Summary in English]. SWOV, Den Haag.

[9]. Adminaité-Fodor, D. & Jost, G. (2019). Reducing speeding in Europe. PIN-flash report 36. European Transport Safety Council (ETSC), Brussels.

[10]. Duijm, S., Kraker, J. de, Schalkwijk, M., Boekwijt, L., et al. (2012). PROV 2011 Periodiek Regionaal Onderzoek Verkeersveiligheid – Bijlagenrapport. Rijkswaterstaat, Dienst Verkeer en Scheepvaart, Delft.

[11]. Rudin-Brown, C.M. (2004). Vehicle height affects drivers’ speed perception: Implications for rollover risk. In: Transportation Research Record, vol. 1899, nr. 1, p. 84-89.

[12]. OECD/ECMT (2006). Speed management. Organisation for Economic Co-operation and Development OECD/European Conference of Ministers of Transport ECMT, Paris.

[13]. Cameron, M.H. & Elvik, R. (2010). Nilsson's Power Model connecting speed and road trauma: Applicability by road type and alternative models for urban roads. In: Accident Analysis & Prevention, vol. 42, nr. 6, p. 1908-1915.

[14]. ITF (2018). Speed and crash risk. IRTAD Research Report. International Transport Forum, ITF/OECD, Paris.

[15]. Elvik, R., Vadeby, A., Hels, T. & Schagen, I. van (2019). Updated estimates of the relationship between speed and road safety at the aggregate and individual levels. In: Accident Analysis & Prevention, vol. 123, p. 114-122.

[16]. Solomon, D. (1964). Accidents on main rural highways related to speed, driver and vehicle. Bureau of Public Roads, U.S. Department of Commerce. United States Government Printing Office, Washington, D.C.

[17]. Kloeden, C., McLean, A.J. & Glonek, G. (2002). Reanalysis of travelling speed and the rate of crash involvement in Adelaide South Australia. Report No. CR 207. Australian Transport Safety Bureau ATSB, Civic Square, ACT.

[18]. Kloeden, C.N., McLean, A.J., Moore, V.M. & Ponte, G. (1997). Travelling speed and the rate of crash involvement. Volume 1: findings. Report No. CR 172. Federal Office of Road Safety FORS, Canberra.

[19]. Kloeden, C.N., Ponte, G. & McLean, A.J. (2001). Travelling speed and the rate of crash involvement on rural roads. Report No. CR 204. Australian Transport Safety Bureau ATSB, Civic Square, ACT.

[20]. Taylor, M.C., Lynam, D.A. & Baruya, A. (2000). The effects of drivers’ speed on the frequency of road accidents. TRL Report, No. 421. Transport Research Laboratory TRL, Crowthorne, Berkshire.

[21]. Tejero, P. & Chóliz, M. (2002). Driving on the motorway: the effect of alternating speed on driver's activation level and mental effort. In: Ergonomics, vol. 45, nr. 9, p. 605-618.

[22]. Rosén, E., Stigson, H. & Sander, U. (2011). Literature review of pedestrian fatality risk as a function of car impact speed. In: Accident Analysis & Prevention, vol. 43, nr. 1, p. 25-33.

[23]. CROW (2012). Basiskenmerken wegontwerp: categorisering en inrichting van wegen. Publicatie 315. CROW, Ede.

[24]. SWOV (2018). Sustainable Safety 3rd edition – The advanced vision for 2018-2030. Principles for design and organization of a casualty-free road traffic system. SWOV, The Hague.

[25]. Schagen, I.N.L.G. van, Wegman, F.C.M. & Roszbach, R. (2004). Veilige en geloofwaardige snelheidslimieten. Een strategische verkenning [Safe and credible speed limits. A strategic exploration]. R-2004-12 [Summary in English]. SWOV, Leidschendam.

[26]. Aarts, L., Pumberger, A., Lawton, B., Charman, S., et al. (2011). Road authority pilot and feasibility study. Deliverables 3 and 4 of the ERASER project. SWOV, Leidschendam.

[27]. Wegman, F. & Aarts, L. (2006). Advancing Sustainable Safety; National Road Safety Outlook for 2005-2020. SWOV, Leidschendam.

[28]. Schagen, I. van & Feypell, V. (2011). Speed and speed management for road safety. An overview of the findings of the OECD Working Group on speed management. In: Twisk, D. & Nickel, W.R. (red.), Fit to Drive: Proceedings of the 5th International Traffic Expert Congress. April 6th-8th 2011, The Hague. Kirschbaum Verlag.

[29]. CROW (2014). Richtlijn drempels, plateaus en uitritten. CROW, Ede.

[30]. Schagen, I. van, Commandeur, J.J.F., Goldenbeld, C. & Stipdonk, H. (2016). Monitoring speed before and during a speed publicity campaign. In: Accident Analysis & Prevention, vol. 97, p. 326-334.

[31]. Knaap, P. van der (2021). Verkeer is ‘gedrag’, maar verkeersveiligheid is méér dan ‘gedrag’. De effecten van voorlichting en educatie worden makkelijk overschat zolang goede evaluatie uitblijft. In: Verkeerskunde, vol. 72, nr. 2, p. 18-19.

[32]. SWOV (2019). Verhoging snelheidslimiet op autosnelwegen. Veiligheidseffecten 130km/uur-limiet vooralsnog niet eenduidig. R-2019-30. SWOV, Den Haag.

[33]. SWECO (2019). Verkeersveiligheidsanalyse snelheidsverhoging autosnelwegen, 2007-2017. Sweco Nederland, De Bilt.

[34]. Vis, A.A. & Kaal, I. (1993). De veiligheid van 30 km/uur-gebieden. Een analyse van letselongevallen in 151 heringerichte gebieden in Nederlandse gemeenten [Safety of 30 km/h areas. An analysis of injury accidents in 151 reorganized areas in Dutch municipalities]. R-93-17 [Summary in English]. SWOV, Leidschendam.

[35]. Weijermars, W.A.M. & Schagen, I.N.L.G. van (2009). Tien jaar Duurzaam Veilig. Verkeersveiligheidsbalans 1998-2007  [Ten years of Sustainable Safety. Road safety assessment 1998-2007]. R-2009-14 [Summary in English]. SWOV, Leidschendam.

[36]. Steinbach, R., Perkins, C., Edwards, P., Beecher, D., et al. (2016). Speed cameras to reduce speeding traffic and road traffic injuries. Cochrane Injuries Group, London School of Hygiene & Tropical Medicine, London.

[37]. Høye, A. (2014). Speed cameras, section control, and kangaroo jumps–a meta-analysis. In: Accident Analysis & Prevention, vol. 73, p. 200-208.

[38]. Lai, F., Carsten, O. & Tate, F. (2012). How much benefit does Intelligent Speed Adaptation deliver: An analysis of its potential contribution to safety and environment. In: Accident Analysis & Prevention, vol. 48, p. 63-72.

[39]. Ryan, M. (2018). Intelligent Speed Assistance. A review of the literature. Irish Road Safety Authority.

[40]. Pas, J.W.G.M. van der, Kessels, J., Veroude, B.D.G. & Wee, B. van (2014). Intelligent speed assistance for serious speeders: The results of the Dutch Speedlock trial. In: Accident Analysis & Prevention, vol. 72, p. 78-94.

[41]. CROW (2015). Basiskenmerken kruispunten en rotondes. Publicatie 315A. CROW Kenniscentrum voor verkeer, vervoer en infrastructuur, Ede.

[42]. Hourdos, J., Liu, Z., Dirks, P., Liu, H.X., et al. (2017). Development of a queue warning system utilizing ATM infrastructure system development and field-testing. Minnesota Department of Transportation.

[43]. Lint, H. van, Nguyen, T.T., Krishnakumari, P., Calvert, S.C., et al. (2020). Estimating the safety effects of congestion warning systems using carriageway aggregate data. In: Transportation Research Record, vol. 2674, nr. 11, p. 278-288.

[44]. Sanden, K. van der, Kooi, F., Alferdinck, J., Bijl, P., et al. (2021). Maximumsnelheden in signaalgevers: Perceptie-onderzoek. TNO 2021 R10138. TNO in opdracht van Rijkswaterstaat, Soesterberg.

[45]. Janssen, C., Donker, S., Hessels, R., Hooge, I., et al. (2021). De invloed van frequente aanduiding van maximumsnelheid boven de weg op het gedrag van de weggebruiker: Literatuuronderzoek. Universiteit Utrecht in opdracht van Rijkswaterstaat, Utrecht.

[46]. Varotto, S.F., Jansen, R., Bijleveld, F. & Nes, N. van (2021). Driver speed compliance following automatic incident detection: Insights from a naturalistic driving study. In: Accident Analysis & Prevention, vol. 150.

[47]. Blom, M., Blokdijk, D. & Weijters, G. (2017). Recidive na een educatieve maatregel voor verkeersovertreders of tijdens een Alcoholslotprogramma. Cahier 2017-15. Wetenschappelijk Onderzoek- en Documentatiecentrum WODC, Den Haag.

[48]. Phillips, R.O., Ulleberg, P. & Vaa, T. (2011). Meta-analysis of the effect of road safety campaigns on accidents. In: Accident Analysis & Prevention, vol. 43, nr. 3, p. 1204-1218.

[49]. Bax, C., Goldenbeld, C., Petegem, J.W.H. van, Mons, C., et al. (2019). Evaluatie buurtacties in 30km/uur-straten; Verkeersveiligheidsgevoelens, motivatie en gereden snelheden onderzocht in vijf gemeenten. R-2019-4. SWOV, Den Haag.

[50]. Groot-Mesken, J. de & Vlakveld, W.P. (2014). Een duwtje in de goede richting - verkeersveilig gedrag : hoe kan verkeersveiligheidsbeleid profiteren van inzichten rondom automatische gedragsbeïnvloeding? [A nudge in the right direction: safe traffic behaviour. How can road safety policy benefit from knowledge about automatic behaviour change?] R-2014-13 [Summary in English]. SWOV, Den Haag.

[51]. Goldenbeld, C., Groot-Mesken, J. de & Temürhan, M. (2017). Nudging van rijsnelheid via Dick Bruna-borden: een veldexperiment. De effecten op werkelijk gereden snelheden in vijf gemeenten onderzocht [Nudging driving speed using Dick Bruna traffic signs: a field experiment. Study of the actual speeds driven in five municipalities in the Netherlands]. R-2017-11 [Summary in English]. SWOV, Den Haag.

[52]. Ljung Aust, M., Baldanzini, N., Bakker, B., Berghaus, M., et al. (2020). Final Measures; Deliverable D5.5 of the H2020 project MeBeSafe. European Commission, Brussels.

3 + 11 =
Solve this simple math problem and enter the result. E.g. for 1+3, enter 4.

Would you like to cite this fact sheet?

SWOV publication

This is a publication by SWOV, or that SWOV has contributed to.