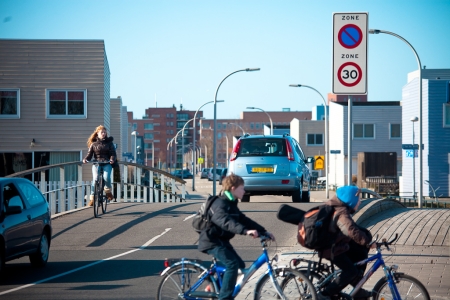
The number of road deaths on 30 km/h roads fluctuates over time (see Table 1), but with an average of 32 deaths per year has remained virtually unchanged for the past 10 years [6]. In this period, the proportion of road deaths on 30 km/h roads has risen from less than 5% to over 6%. On other road types progress has been made in reducing the number of road deaths. On 50 km/h roads, for example, the number of casualties has been declining with 6.7% per year and on provincial roads with a limit of 80 km/h or higher the annual decline has been 5.9%. A possible explanation for the failure of a decline on 30 km/h roads is that the number of these roads (the road length) has increased over the last 10 years. This means that in a relative sense these roads have had to process more traffic than roads with a different speed limit. However, recent information on the road lengths per road type is not available; therefore this possible explanation cannot be investigated.
|
|
Number of registered road deaths |
Proportion of all registered road deaths |
|
2007 |
35 |
4.9% |
|
2008 |
32 |
4.7% |
|
2009 |
28 |
4.3% |
|
2010 |
31 |
5.8% |
|
2011 |
25 |
4.6% |
|
2012 |
35 |
6.2% |
|
2013 |
41 |
8.6% |
|
2014 |
25 |
5.3% |
|
2015 |
36 |
6.8% |
|
2016 |
33 |
6.2% |
Table 1. The number of road deaths in the Netherlands and the proportion of road deaths of the total number of road deaths on roads with a 30 km/h speed limit (urban and rural, excluding road works) in the period 2007 - 2016. Source: I&W.
No recent information is available on the number of serious road injuries and the circumstances of the crashes on roads with a 30 km/h speed limit. Presently, these crashes are rarely registered by the police. Up to 2009 the data was more complete. Table 2 shows that during the period 1998-2009 the police registered about 500 to 600 serious road injuries per year in 30 km/h zones. The proportion of serious road injuries in 30 km/h zones relative to all serious traffic injuries in the Netherlands that were registered by the police in this period has risen to more than 11% in the years 2007-2009. At the same time it can be observed that the increase in the road length of 30 km/h roads in this period (annual average 20%) was much greater than the increase in the number of serious traffic injuries (an average annual increase of 20 %). This means that in the period 1998-2009 the number of casualties on 30 km/h roads developed relatively favourably.
However, we must point out that the numbers presented here are the serious road injuries that haven been registered by the police and that the police are far from recording all traffic crashes with serious road injuries. It is well known that especially cycling crashes in which no motorized traffic is involved are hardly registered; their number is estimated to be less than 10%. At the same time, we know that many serious road injuries occur in these crash types (see also SWOV Fact sheet Cyclists). In recent years this concerned over 50% of all serious road injuries [6]. Therefore, the numbers and percentages that are presented here are (substantial) underestimated.
|
|
Registered serious road injuries |
Proportion of all registered serious road injuries |
Development road length 30 km/h roads |
|
1998 |
533 |
6.2% |
+ 225% |
|
1999 |
586 |
6.6% |
|
|
2000 |
527 |
6.6% |
|
|
2001 |
460 |
6.5% |
|
|
2002 |
522 |
7.4% |
|
|
2003 |
580 |
8.4% |
|
|
2004 |
525 |
8.5% |
+73% |
|
2005 |
557 |
9.7% |
|
|
2006 |
502 |
10.1% |
|
|
2007 |
602 |
11.4% |
|
|
2008 |
605 |
11.6% |
|
|
2009 |
493 |
11.1% |
Table 2. Number of police-registered serious road injuries (injury severity MAIS2+), proportion of the total number of police-registered serious road injuries and the development of the road length of 30 km/h roads during the period 1998-2009. Source calculation serious road injuries: SWOV based on I&W and DHD; Source road length: [4]).
