Below you will find the list of references that are used in this fact sheet. On our library portal you can find more literature on this topic.
[1]. CROW (2012). ASVV Aanbevelingen voor stedelijke verkeersvoorzieningen. CROW, Ede.
[2]. CROW (2012). Basiskenmerken wegontwerp: categorisering en inrichting van wegen. Publicatie 315. CROW, Ede.
[3]. Infopunt Duurzaam Veilig Verkeer (2000). Sobere inrichting van 30- en 60 km/h-gebieden; een illustratieve aanpak met praktijkvoorbeelden. Infopunt Duurzaam Veilig Verkeer, Ede.
[4]. Weijermars, W.A.M. & Schagen, I.N.L.G. van (2009). Tien jaar Duurzaam Veilig. Verkeersveiligheidsbalans 1998-2007. R-2009-14. SWOV, Leidschendam.
[5]. Rosén, E., Stigson, H. & Sander, U. (2011). Literature review of pedestrian fatality risk as a function of car impact speed. In: Accident Analysis & Prevention, vol. 43, nr. 1, p. 25-33.
[6]. Weijermars, W., Schagen, I. van, Moore, K., Goldenbeld, C., et al. (2017). Monitor Verkeersveiligheid 2017; Nieuwe impuls nodig voor verbetering verkeersveiligheid. R-2017-17. SWOV, Den Haag.
[7]. Berends, E.M. & Stipdonk, H.L. (2009). De veiligheid van voetgangers en fietsers op 30km/uur-erftoegangswegen. De invloed van de inrichting van erftoegangswegen binnen de bebouwde kom op ongevallen tussen langzaam verkeer en motorvoertuigen. R-2009-6. SWOV, Leidschendam.
[8]. Plasmans, N. & Tuinenburg, D. (2006). Eindevaluatie Pilot subjectieve verkeersonveiligheid regio IJsselland. Aangeboden door de begeleidingsgroep TSV IJsselland. Bureau Verkeershandhaving Openbaar Ministerie, BVOM, Soesterberg.
[9]. Haaf, R. van (2002). Verkeershinder in de woonomgeving. Een handleiding met beoordelingsmethoden en mogelijke? maatregelen voor verschillende soorten verkeershinder. Faculteit Civiele Techniek en Geowetenschappen, Sectie Infrastructuurplanning, Technische Universiteit Delft.
[10]. Dobbenberg, H. & List, R.S. (2007). De aanpak van subjectieve verkeersonveiligheid. Een onderzoek naar het terugdringen van de subjectieve verkeersonveiligheid in 30 km/u-gebieden. Christelijke Hogeschool Windesheim, Zwolle.
[11]. Minnen, J. van (1999). Geschikte grootte van verblijfsgebieden; een theoretische studie met toetsing aan praktijkervaringen. Rapport R-99-25. SWOV, Leidschendam.
[12]. Wesemann, P. (2000). Verkeersveiligheidsanalyse van het concept-NVVP. Deel 2: Kosten- en kosteneffectiviteit; Beschrijving en berekening per maatregel en toetsing aan financiële randvoorwaarden. D-2000-9II. SWOV, Leidschendam.
[13]. CROW (1999). OV-vriendelijke infrastructuur. CROW, Ede.
[14]. Vis, A.A. & Kaal, I. (1993). De veiligheid van 30 km/uur-gebieden. Een analyse van letselongevallen in 151 heringerichte gebieden in Nederlandse gemeenten. R-93-17. SWOV, Leidschendam.
[15]. Elvik, R., Høye, A., Vaa, T. & Sørensen, M. (2009). The handbook of road safety measures. Second edition. Emerald, UK.
[16]. Webster, D.C. & Layfield, R.E. (2003). Review of 20 mph zones in London Boroughs. TRL report PPR243. Transport Research Laboratory, Crowthorne.
[17]. Lindenmann, H.P. (2005). The effects on road safety on 30 kilometer-per-hour zone signposting in residential districts. In: ITE Journal, vol. 75, nr. 6, p. 50-54.
[18]. Fietsersbond (2018). Campagne: 30 is het nieuwe 50! Fietsersbond. Geraadpleegd 06 maart 2018 op https://fietsersbond.verbeterdebuurt.nl/campagne/30-is-het-nieuwe-50.
[19]. VVN (2018). Dossier Snelheid. Veilig Verkeer Nederland, VVN. Geraadpleegd 06 maart 2018 op https://vvn.nl/dossier/snelheid.
[20]. Schagen, I.N.L.G. van, Commandeur, J.F., Stipdonk, H.L., Goldenbeld, C., et al. (2010). Snelheidsmetingen tijdens de voorlichtingscampagne 'Hou je aan de snelheidslimiet'. R-2010-09. SWOV, Leidschendam.
[21]. Duivenvoorden, C.W., Stelling, A.E., Goldenbeld, C. & Hagenzieker, M.P. (2013). Evaluatie van een beloningsactie in het verkeer in Limburg. R-2013-07. SWOV, Leidschendam.
[22]. Goldenbeld, C., Groot-Mesken, J. de & Temürhan, M. (2017). Nudging van rijsnelheid via Dick Bruna-borden: een veldexperiment. R-2017-11. SWOV, Den Haag.
[23]. Elvik, R. (2009). The Power Model of the relationship between speed and road safety: update and new analyses. TØI Report 1034/2009. Institute of Transport Economics TØI, Oslo.
[24]. Pas, J.W.G.M. van der, Marchau, V.A.W.J., Walker, W.E., Wee, G.P. van, et al. (2012). ISA implementation and uncertainty: a literature review and expert elicitation study. In: Accident Analysis & Prevention, vol. 48, p. 83-96.
[25]. Kamphuis, A. (2017). Participatiepunt 2016. Kerncijfers en analyse. Veilig Verkeer Nederland, Utrecht.

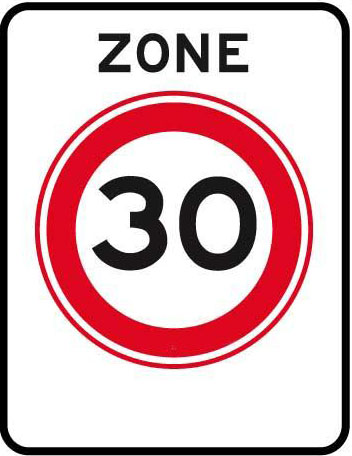 A01-30-ZB
 A02-30-ZE
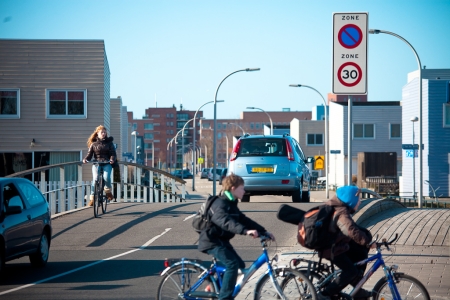
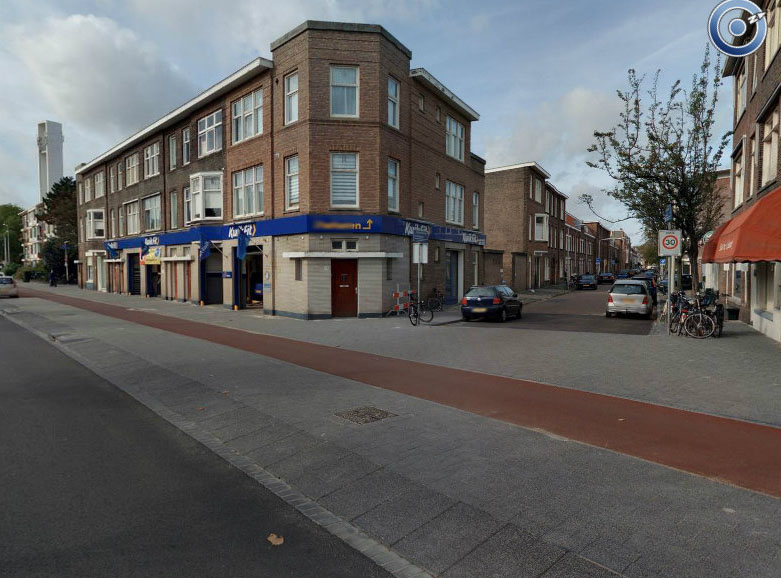 Access road ending in an exit construction (Source: CycloMedia)
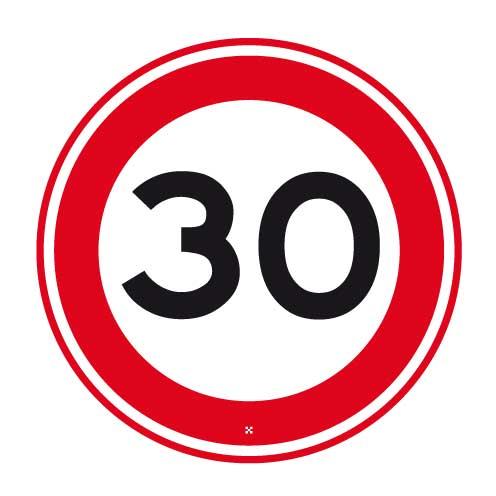 A01-30 maximum snelheid 30
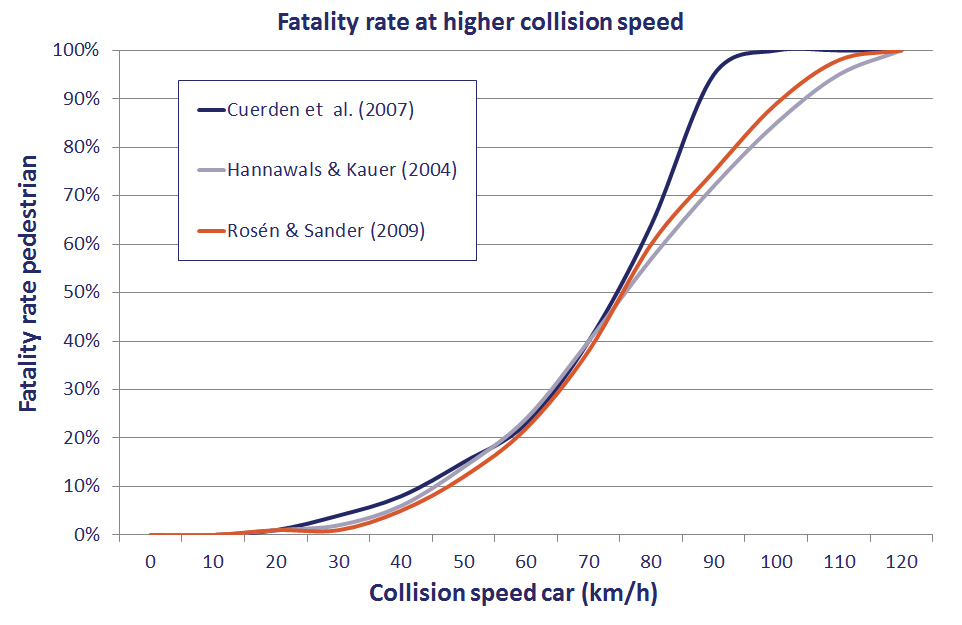 Figure 1. The relationship between impact speed and fatality risk of pedestrians in crashes with a passenger car according to some recent studies (in: Rosén et al., 2011
 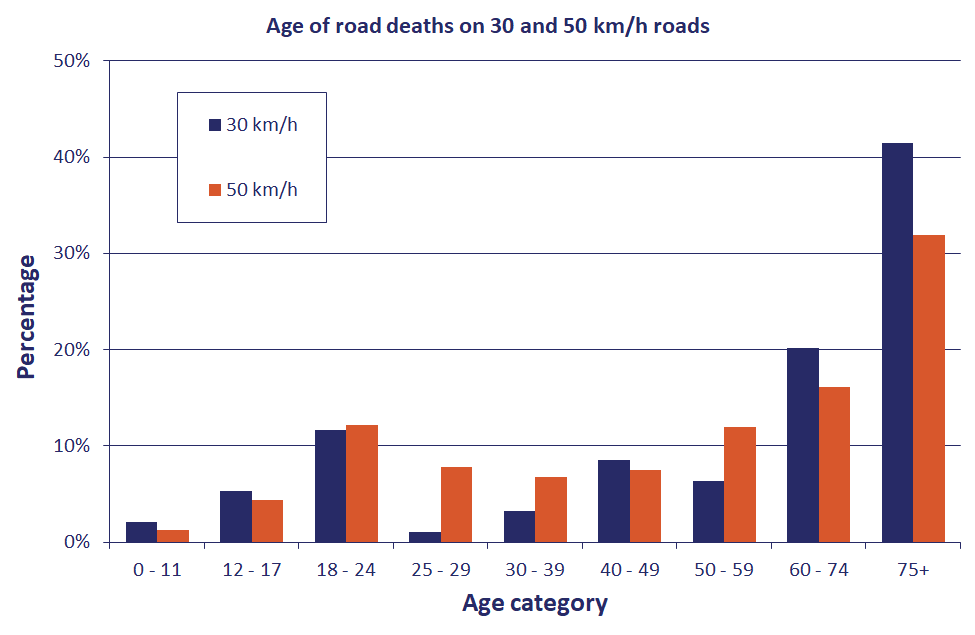 Figure 2. Distribution by age of road deaths (period 2014-2016) on 30 km/h roads (N=94) and 50 km/h roads (N=385), excluding temporary speed limits due to special circumstances (e.g. road works, road closure, other crash or congestion). Source: IenW.
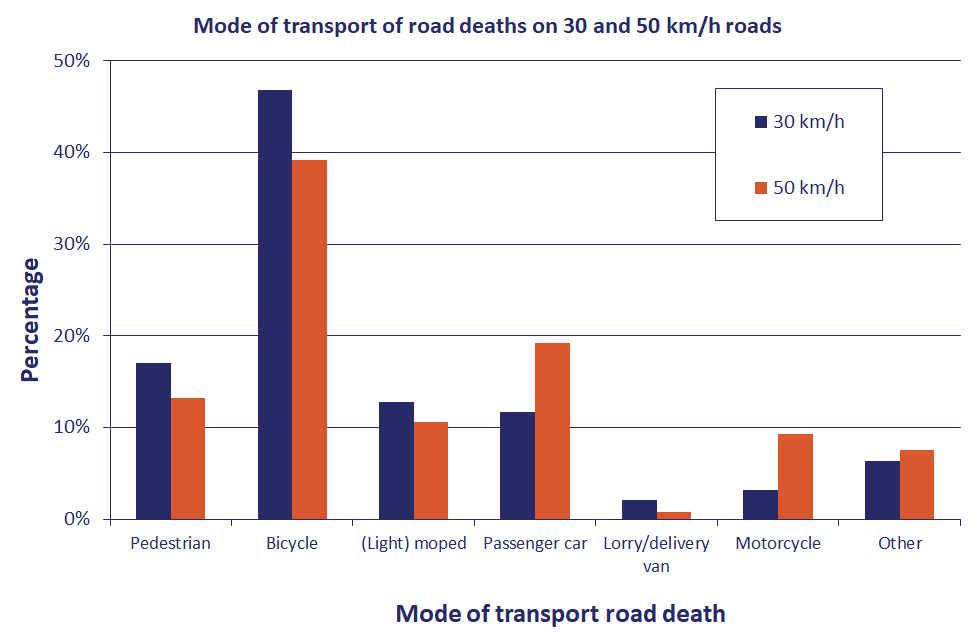 Figure 3. Mode of transport of road deaths (period 2014-2016) on 30 km/h roads (N=94) and 50 km/h roads (N=385), excluding temporary speed limits due to special circumstances (e.g. road works, road closure, other crash or congestion). Source: IenW.
 G05 Woonerf
 G06 End of woonerf