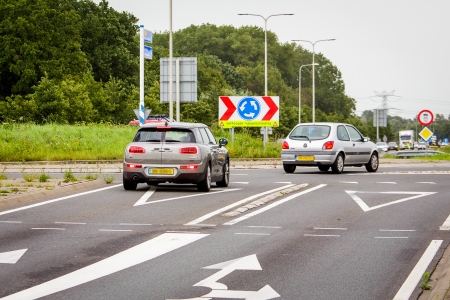
About one third of all road deaths can be attributed to intersections[i]. The share of road deaths on urban intersections (almost half) is higher than that on intersections outside the urban area (somewhat under a quarter). Among cyclists, the number of road deaths on intersections is higher than on road sections: an annual average of 54% of the total number. A second noteworthy category are (light) moped riders: half their annual number of road deaths can be attributed to intersections. For the other modes of transport, the share of fatal intersection crashes is much smaller when compared to the number of fatal road section crashes. Examples are fatal car crashes at intersections at 19% and pedestrian fatalities at 26% (see table 2 below). Table 2 shows the 2015-2019 average number of road deaths at intersections compared to the number at road sections, differentiated for urban or non-urban area, and for mode of transport. The table shows absolute numbers and percentages.
|
Total 2015 – 2019 averages |
|
In the urban area |
|
Outside the urban area |
|||||||||||||
|
Inter- section |
|
Road section |
|
Inter-section |
|
Road section |
|
Inter-section |
|
Road section |
|||||||
|
# |
% |
|
# |
% |
|
# |
% |
|
# |
% |
|
# |
% |
|
# |
% |
|
|
Total |
175 |
31% |
|
382 |
69% |
|
99 |
48% |
|
109 |
52% |
|
64 |
22% |
|
233 |
78% |
|
Pedestrian |
14 |
26% |
|
39 |
74% |
|
12 |
36% |
|
21 |
64% |
|
1 |
7% |
|
13 |
93% |
|
Bicycle |
76 |
54% |
|
64 |
46% |
|
49 |
60% |
|
33 |
40% |
|
24 |
49% |
|
25 |
51% |
|
(light) Moped |
15 |
42% |
|
21 |
58% |
|
10 |
50% |
|
10 |
50% |
|
4 |
31% |
|
9 |
69% |
|
Motorcycle/scooter |
12 |
27% |
|
33 |
73% |
|
5 |
36% |
|
9 |
64% |
|
6 |
21% |
|
23 |
79% |
|
Car |
42 |
19% |
|
183 |
81% |
|
13 |
33% |
|
26 |
67% |
|
26 |
16% |
|
138 |
84% |
|
Truck and delivery van |
3 |
11% |
|
25 |
89% |
|
1 |
33% |
|
2 |
67% |
|
2 |
9% |
|
21 |
91% |
|
Other |
12 |
43% |
|
16 |
57% |
|
8 |
50% |
|
8 |
50% |
|
3 |
38% |
|
5 |
63% |
Table 2. The average annual number of BRON-registered road deaths at intersections and at road sections in 2015-2019, disaggregated for transport mode and location in or outside the urban area. Of 7% of fatal crashes at intersections it is unknown whether they occurred in or outside the urban area. Moreover, an actual 15% of road deaths remain unregistered. For these, location data are unavailable, not even whether the crash occurred at an intersection or road section[ii].
[i] The term intersection is used here, but it is uncertain whether the crash took place at an intersection or crossing since the quality of the location registration in BRON is hard to determine (see the section What do we mean by intersections? ). ‘Intersection’ therefore necessarily covers both locations
[ii] We do not know whether the unregistered road deaths more often occurred on road sections or at intersections; this may lead to a distorted picture of crash distribution when using only the BRON-registered data. Underreporting is highest among cyclists, who generally crash at intersections more often. Bicycle-only crashes, however, that are even less registered, more often occur on road sections.
