Figure 3 shows the 2023 shares of road deaths by their mode of transport at the time of the crash. In 2023, most road deaths occurred among cyclists (39%, of whom at least 43% were pedelec riders) and car occupants (28%). Powered two-wheelers (a total of 11%) are the third largest group; for nearly six out of ten (59%), these were motorcyclists, and 41% were (light) moped riders (including speed pedelecs). In 2023, 10% of the road deaths were pedestrians, 8% were mobility scooter riders, and 2% truck or delivery van occupants. Of two road deaths, the mode of transport is either ‘other’ or ‘unknown’.
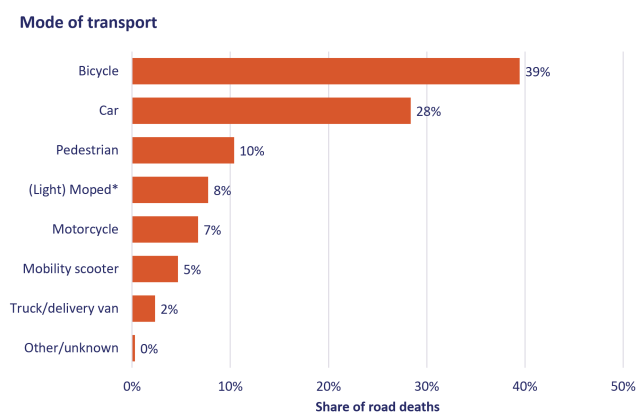
Figure 3. Road deaths in the Netherlands in 2023, by mode of transport. *The category (light) mopeds also includes microcars and speed pedelecs. Source: CBS StatLine (Road Death Statistics).
Figure 4 shows the age distribution of the road deaths in 2023. Almost a quarter of the road deaths (155; 23%) were people aged 80 or over. Almost one in five road deaths was aged 70 or over (143; 21%). What is generally known about the risks of older road users can be found in SWOV fact sheet Older road users. In addition, the number of older people in the entire population is also relevant. The number of road deaths among children and youngsters aged 0-14 was lowest (20; 3%).
In 2023, 72% of the road deaths were males, 28% females.
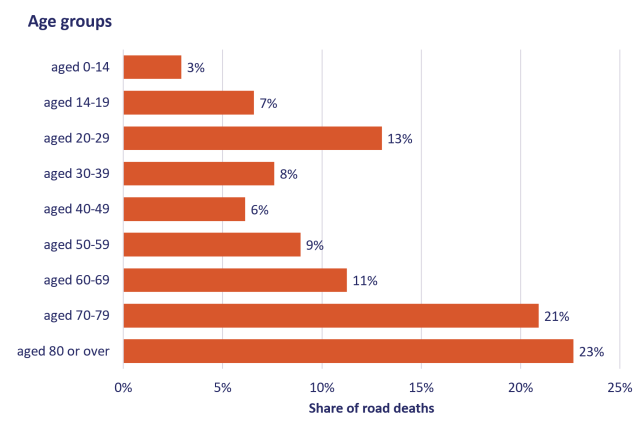
Figure 4. Road deaths in the Netherlands in 2023, by age group. Source: CBS StatLine (Road Death Statistics).