Road deaths in the Netherlands

Updated

This fact sheet covers road deaths: the annual number in the Netherlands, how this number has developed since 1950, and characteristics such as the casualty’s age and mode of transport, and crash locations. After a rise in the 1950s and 1960s, the number of road deaths in the Netherlands has shown a gradual decline since 1973. In the last few years, this decline has stagnated. In 2021, there were 582 road deaths in the Netherlands. Although this number is again lower than in previous years, it is not the lowest number up till now, in spite of it being a ‘COVID-19 year’ once more.

In 2021, slightly more than one third of the road deaths are cyclists (207; 36%), and three out of ten are car occupants (175; 30%). Most road deaths occur among older road users: in 2021, 220 (38%) were aged 70 or over. By contrast, relatively few children (0-14 years) are killed in Dutch traffic; in 2021, - as in the year before - 17 (3%) were killed.

When comparing the number of road deaths for different subgroups (e.g. age, mode of transport, road type), it should be borne in mind that, in any case, the number of crash casualties depends on the distance travelled: the more people travel, the more frequently they may be involved in crashes. The number of casualties also depends on the safety characteristics of this exposure: roads are either safe or less safe and the same goes for vehicles. In addition, traffic behaviour also affects the probability of being involved in a crash. The number of road deaths in a particular subgroup is, therefore, not just determined by how ‘dangerous’ road use is for that subgroup (the risk of that specific age group, gender, mode of transport or road type), but also by the distance travelled by that subgroup (by that mode of transport, on that road type, etc.). Finally, chance will always be a factor as well. (Small) differences between numbers of road deaths in consecutive years may be coincidental.

How many road deaths were there in the Netherlands in 2021?

In 2021, the number of road deaths amounted to 582. That is 28 fewer than the 610 road deaths in 2020.

What is the official definition of a road death?

The international definition of a road death is as follows: a casualty who, in or after a crash on a public road in which at least one moving vehicle is involved, dies within thirty days from the consequences of that crash, with the exception of suicides [1]. In the Netherlands, this international definition is also adopted [2].

How is the number of road deaths in the Netherlands determined?

Before 1996, all road death statistics in the Netherlands were based on police reports. Since 1996, the number of road deaths has been determined by Statistics Netherlands, in close consultation with the Ministry of Infrastructure and Water Management (IenW). Statistics Netherlands analyses data from three different data sources to determine the number of road deaths in the Netherlands:

  1. Data from the cause of death forms filled out by a coroner;
  2. The district court files on deaths by unnatural causes;
  3. The (provisional) Database of Registered Crashes in the Netherlands (in Dutch: BRON), based on police crash reports. The final version of this database is published by the Ministry of Infrastructure and Water Management (IenW).

By linking and comparing these data sources, Statistics Netherlands compiles the total number of road deaths in the Road Death Statistics. This can be seen in Figure 1.

Afbeelding
Figure 1. The number of road deaths is determined using three sources. A road death can be included in one or more of these sources.

Statistics Netherlands departs from the premise that all road deaths are registered in at least one of the three data sources and, consequently, that there are no traffic deaths that are not registered in any of the data sources. This implies that the area outside the three coloured circles in Figure 1 contains no road deaths. Based on analysis of the data, Statistics Netherlands determines the number of road deaths. Double counts are removed, and casualties that should not be included in the road deaths in the Netherlands (such as crashes abroad, crashes off public roads, suicides, natural causes of death) are removed from the database.

What is the difference between the number of road deaths registered in BRON and the actual number of road deaths?

Between 2012 and 2021, the registered number of road deaths in BRON was approximately 14% lower than the number determined by Statistics Netherlands in the Road Death Statistics, which is considered to be the actual number. In 2021, the BRON registration rate was 87%: 74 of the 582 road deaths (according to Statistics Netherlands) were missing in the BRON database. The reasons for these missing data are subject to further investigation by SWOV. BRON is known to particularly miss crashes not involving any other parties, or exclusively involving non-motorized traffic, or when a casualty dies at a later date, or when there is confusion about the type of crash (vehicle entering the water, crashes at railways, indisposition, suicide, intent).

Since 2012, Statistics Netherlands has not been allowed to report to the Ministry of Infrastructure and Water Management which fatalities in the provisional BRON file it has not included in the Road Death Statistics. Before 2012 this difference was reported. This means that since 2012 an undetermined number of road deaths in BRON are not in fact road deaths in the Road Death Statistics. The result is that for some groups the number of road deaths according to Statistics Netherlands may be lower than the number reported by The Ministry of Infrastructure and Water Management in BRON.

How has the number of road deaths in the Netherlands developed over the past ten years?

Figure 2 shows the development of the actual number of road deaths in the Road Death Statistics according to mode of transport over the last ten years. Until some years ago, the number of road deaths among car occupants showed a considerable decline, to 187 in 2014, but from 2015 onwards the number increased to 237 in 2019; Thereafter, the number again decreased to 175 in 2021, the lowest number ever. The number of pedestrian road deaths also steadily declined until 2013, but since then the number has fluctuated around 50 to 60. In 2020 and 2021, however, fewer pedestrians were killed: just over 40 (43 in 2021). The general decline in the number of road deaths until 2013 is less obvious for other modes of transport.

The number of road deaths among cyclists does not seem to have decreased for years. Since 2000, the number of deaths among cyclists has not been as high as it was in 2020 (229). In 2021, the number of road deaths among cyclists amounted to 207. In 2020 and 2021, more cyclists than car occupants were killed in traffic. In 2017, cyclist road deaths outnumbered the road deaths among car occupants for the first time. Statistics Netherlands indicates that at least 80 (39%) of the cyclists killed were riding a pedelec. The road deaths in the category ‘mobility scooters/disability vehicles’ were all, as reported by Statistics Netherlands, mobility scooter riders as from 2009.

Afbeelding

Figure 2. Number of road deaths in the Netherlands in the last ten years, according to mode of transport. The category (light-)mopeds also includes microcars and speed pedelecs. Source: Statistics Netherlands StatLine (Road Death Statistics)

How is the number of road deaths distributed across different modes of transport, age groups and gender?

Figure 3 shows the 2021 shares of road deaths by their mode of transport at the time of the crash. Most fatalities occurred among cyclists (36%) and car occupants (30%). Powered two-wheelers (a total of 17%) are the third largest group; slightly more than half of them being motorcyclists, the rest being (light) moped riders (including microcars or speed pedelecs). In 2021, 7% of the road deaths were pedestrians, 5% riders of mobility scooters and 2% a truck or delivery van occupant. The mode of transport of 2% of the road deaths is either ‘other mode of transport’ or ‘unknown’.

Afbeelding

Figure 3. Road deaths in the Netherlands in 2021, by mode of transport. *The category (light) mopeds also includes microcars and speed pedelecs. Source: CBS StatLine (Road Death Statistics).

Figure 4 shows the age distribution of the road deaths in 2021. Most road deaths (117; 20%) involved people aged 80 or over, followed by people in their 70s (103; 18%). What is generally known about the risks of older road users can be found in SWOV fact sheet Older road users. In addition, the number of older people in the entire population is also relevant. The number of road deaths among children and youngsters under 15 years old was lowest (17; 3%).

In 2021, 73% of the road deaths were males, 27% females.

Afbeelding

Figure 4. Road deaths in the Netherlands in 2021, by age group. Source: CBS StatLine (Road Death Statistics).

How is the number of road deaths distributed across different road types?

For the number of road deaths on different types of roads, we have to rely on the police registration of road crashes. The Directorate of Public Works and Water Management converts this registration into its database ‘Registered Crashes in the Netherlands’ (BRON in Dutch) on behalf of the Ministry of Infrastructure and Water Management. In the Road Death Statistics, of the 582 road deaths in 2021, 508 were registered in BRON. This implies that for 13% of the crashes in 2021 – the proportion that was registered by Road Death Statistics only – we do not know where the crash occurred. In addition, for 3% of the road deaths registered in BRON we do not know either whether the related fatal crash occurred in or outside the urban area (see Figure 5) and for 3% of the road deaths we do not know which speed limit was valid on the road where the crash occurred (see Figure 6).

Of the road deaths in BRON, 56% occurred outside the urban area (49% of the actual number of road deaths). The remaining 40% (35% of all road deaths) occurred in the urban area. The shares are shown in Figure 5.

Afbeelding
Figure 5. Road deaths 2021, in and outside urban areas. Sources: IenW, (BRON) , Statistics Netherlands (Road Death Statistics), adapted by SWOV.

Figure 6 shows the number of road deaths by speed limit. The largest number of road deaths occurs on 50km/h and 80km/h roads (26% and 23%, respectively, of the actual number of road deaths; this is 30% and 26%, respectively, of the road deaths registered in BRON). On 60km/h roads, the number of road deaths is also substantial, that is: 16% of the road deaths (19% of the road deaths in BRON). On roads with a speed limit of 100, 120 or 130 km/h, the share amounts to 9% (10% in BRON). On 30km/h roads the share is similar (9% of the actual number, 11% in BRON).

In 2021, 59% of the actual number of fatal crashes occurred on road sections and 29% at intersections (see Figure 7; 67% and 33% of the police registered numbers in BRON).  

Afbeelding
Figure 6. Road deaths in 2021, by speed limit; only the limits accounting for more than two road deaths are shown. Sources: IenW, (BRON), Statistics Netherland (Road Death Statistics), adapted by SWOV.
Afbeelding
Figure 7. Road deaths 2021, by road section and intersection. Sources: IenW, (BRON), Statistics Netherlands (Road Death Statistics), adapted by SWOV.

Figure 8 shows the 2021 shares of road deaths by road authority. The largest number of road deaths occurs on municipal roads (54% of the actual number, 62% of the number registered in BRON), followed by regional roads (20% of the actual number and 23% registered in BRON) and national roads (9% of the actual number and 10% registered in BRON). The smallest number of road deaths occurs on roads managed by the remaining road authorities, such as water authorities (4% of the actual number, 5% registered in BRON). These shares not only reflect the degree of hazard on these roads, but also and particularly the number of roads and the amount of traffic on these roads.

Afbeelding
Figure 8. Road deaths 2021, by road authority. Sources: IenW, (BRON), Statistics Netherlands (Road Death Statistics, adapted by SWOV.
What is the risk of a fatal crash in Dutch traffic for different modes of transport?

The fatality risk can be expressed as the number of road deaths per km travelled. In the Netherlands, fatality risk is highest for powered two-wheelers: (light) moped riders and motorcyclists (Figure 9). The figure shows three-year averages known for the last 12 years, since the annually calculated risks are to some extent coincidental due to uncertainties in exposure data and numbers of crashes. The figure also shows that, in 2009-2020, the fatality rate for the different modes of transport decreased. This does not, however, go for cyclists and car occupants.

Afbeelding

Figure 9. The fatality risk (number of road deaths per kilometre travelled) in the Netherlands, for various modes of transport, averaged over three-year periods. Sources: Statistics Netherlands (Road Death Statistics), Dutch Travel Survey (OviN)), On the Road in the Netherlands (OdiN)), Rijkswaterstaat (Dutch Mobility Survey (MON), adapted by SWOV.

How has the number of road deaths in the Netherlands developed since 1950?

In 1950, there were approximately 1,000 road deaths. The number steadily increased to over 3,000 in 1972. From 1973 onwards, the annual number of road deaths has decreased gradually. Figures 10 and 11 show the number of road deaths registered by the police between 1950 and 1995, and the number of road deaths determined by Statistics Netherlands from 1996 onwards. In Figure 10, the road deaths are stratified by mode of transport and shown in shares of the total number of road deaths, and Figure 11 shows the number of road deaths per age group,
while also showing the development of the number of road deaths over time.

Afbeelding

Figure 10. Road deaths in the Netherlands since 1950, by mode of transport (in shares of the annual total). Here, the (light) moped category also includes microcars, mobility scooters and disability vehicles. Sources: Statistics Netherlands (police registration up to and including 1975; Road Death Statistics from 1996 onwards), IenW (VOR, police registration between 1976 and 1995).

Afbeelding
Figure 11. Road deaths in the Netherlands since 1950, by age group. Sources: Statistics Netherlands (police registration up to and including 1975; Road Death Statistics from 1996 onwards), IenW (VOR, police registration between 1976 and 1995).

In 1950, particularly cyclists and pedestrians were killed in traffic. Then, the number of road deaths among moped riders and, above all, car occupants started to rise, which made these modes of transports more and more significant for the overall picture. Since 1973, the number of road deaths has decreased for virtually all modes of transport; an exception is the slightly deviating development for motorcycles and freight and delivery vehicles; in recent years, the number of road deaths among cyclists has also virtually stopped decreasing.

Nowadays, road deaths among children (0-14) are scarce: in 2021 - as in the year before - there were 17 road deaths in this age group. Between 1950 and 1980, youngsters and, above all, children accounted for a large proportion of the number of road deaths. Presently, older road users are the ones who are increasingly killed in traffic.

What are the costs of road crashes for society?

Approximately 11% of the overall costs of road crashes is attributable to road deaths (see Figure 12). More than one third of the total societal costs of road crashes (about 37%) can be attributed to serious road injuries. Casualties with slight injuries (treated in a hospital emergency room) have a share of about 22% and other casualties a share of about 6% in societal costs. About a quarter (24%) of the costs is attributable to crashes with property damage only (PDO).

The overall social costs of road crashes in 2018 were estimated to be 17 billion euro (€16 to €19 billion) [3]). This is more than 2% of the gross domestic product. The costs per road death are about €2.8 million. For more information see SWOV fact sheet Road crash costs. A more recent international study shows that the value of a human life is estimated at €6,3 million, about three times higher than in previous estimations [4].

Afbeelding

Figure 12. Proportions of deaths, serious/slight/other injuries and property damage only (PDO) crashes of the total road crash costs (2018) [3].

What is the target for the number of road deaths?

For 2020, a maximum of 500 road deaths was aimed for [5]. This target was not met [6]. For the next period, no Dutch target has been determined (yet). The minister strives for 0 road casualties in 2050. With an annual reduction of almost 11%, we will arrive at approximately 20 road deaths in 2050 [7]. In the years 2000-2010, the average annual reduction was 4%.

For the coming period, the United Nations and the European Union have set targets for the maximum number of road deaths. Both organisations extended the previous 2010 target, which again implies a 50% reduction of the number of road deaths compared to 10 years before (2019 [i] for the EU [8]; 2021 for the UN [9]). Applying these targets to the Netherlands, this would mean a maximum number of around 300 – 350 road deaths in 2030.[ii] Mid 2021, a parliamentary motion was adopted to use the international target for the Netherlands as well, and to strive for a 50% reduction of the number of road casualties by 2030 [10].


[i]. In early 2022, the EC decided to use 2019 as the reference year instead of 2020; this was decided on account of the effect of the COVID-19 measures on the number of road deaths in several countries.
[ii] NB: The European Union uses the figures reported by police that are supplied by the EU countries themselves. The Dutch government proceeds from the actual numbers determined by Statistics Netherlands.

How does the number of road deaths in the Netherlands relate to the numbers in other countries?

Compared to the official numbers of road deaths reported by other European countries, the actual number of road deaths in the Netherlands in 2020 ranked 11th in Europe [11]. Correction was made for the size of each country, not by comparing the number of casualties, but by comparing traffic mortality (road deaths per inhabitant). In relation to road safety improvement measured in terms of the decrease in the number of road deaths per country in 2020 as contrasted to 2010, the Netherlands ranks 32nd with a decrease of merely 5%. In comparison, the best-performing countries, such as Greece and Norway, realised a 50% reduction in road deaths. It should be noted that the social distancing measures in the context of the COVID-19 pandemic are expected to have contributed to the reduction of road casualties in 2020; there are indications that this contribution may have differed from country to country [12] [13].

In its database CARE, the EU collects information from road crash registrations of the 27 Member States and those of some other countries such as Norway and Switzerland. CARE does not apply a correction for underregistration of road deaths in road crash registrations (BRON in the Netherlands). On the basis of the traffic mortality based on CARE, using provisional data from 2021 [14] the Netherlands ranks fifth within the EU in 2020, and ninth when other European countries, such as Liechtenstein, Norway, Switzerland and Iceland, are included in the comparison [14]. These comparisons yield a distorted picture, because no account was taken of the 13% of road deaths that were not included in BRON, but were determined by Statistics Netherlands. In 2018, ETSC has examined whether other countries also use more than one source for determining the number of road deaths [15]. About half the countries surveyed (17 out of 32) incorporate hospital data, causes of deaths forms or data about deaths by unnatural causes. At this time, the exhaustiveness of road crash registration in the different countries is unknown.

SWOV fact sheet Dutch road safety in an international perspective compares Dutch road safety performance to that of other countries in a broader sense.

Publications and sources

Below you will find the list of references that are used in this fact sheet; all sources can be consulted or retrieved. Via Publications you can find more literature on the subject of road safety.

[1]. European Commission (2016). CARE database CaDaS. Directorate General for Mobility and Transport. European Commission, Brussel.

[2]. CBS (2019). Begrippen. Lijst met begrippen die CBS hanteert in zijn statistieken. CBS. Accessed on 25-10-2020 at www.cbs.nl/nl-nl/onze-diensten/methoden/begrippen?tab=v#id=verkeersdode.
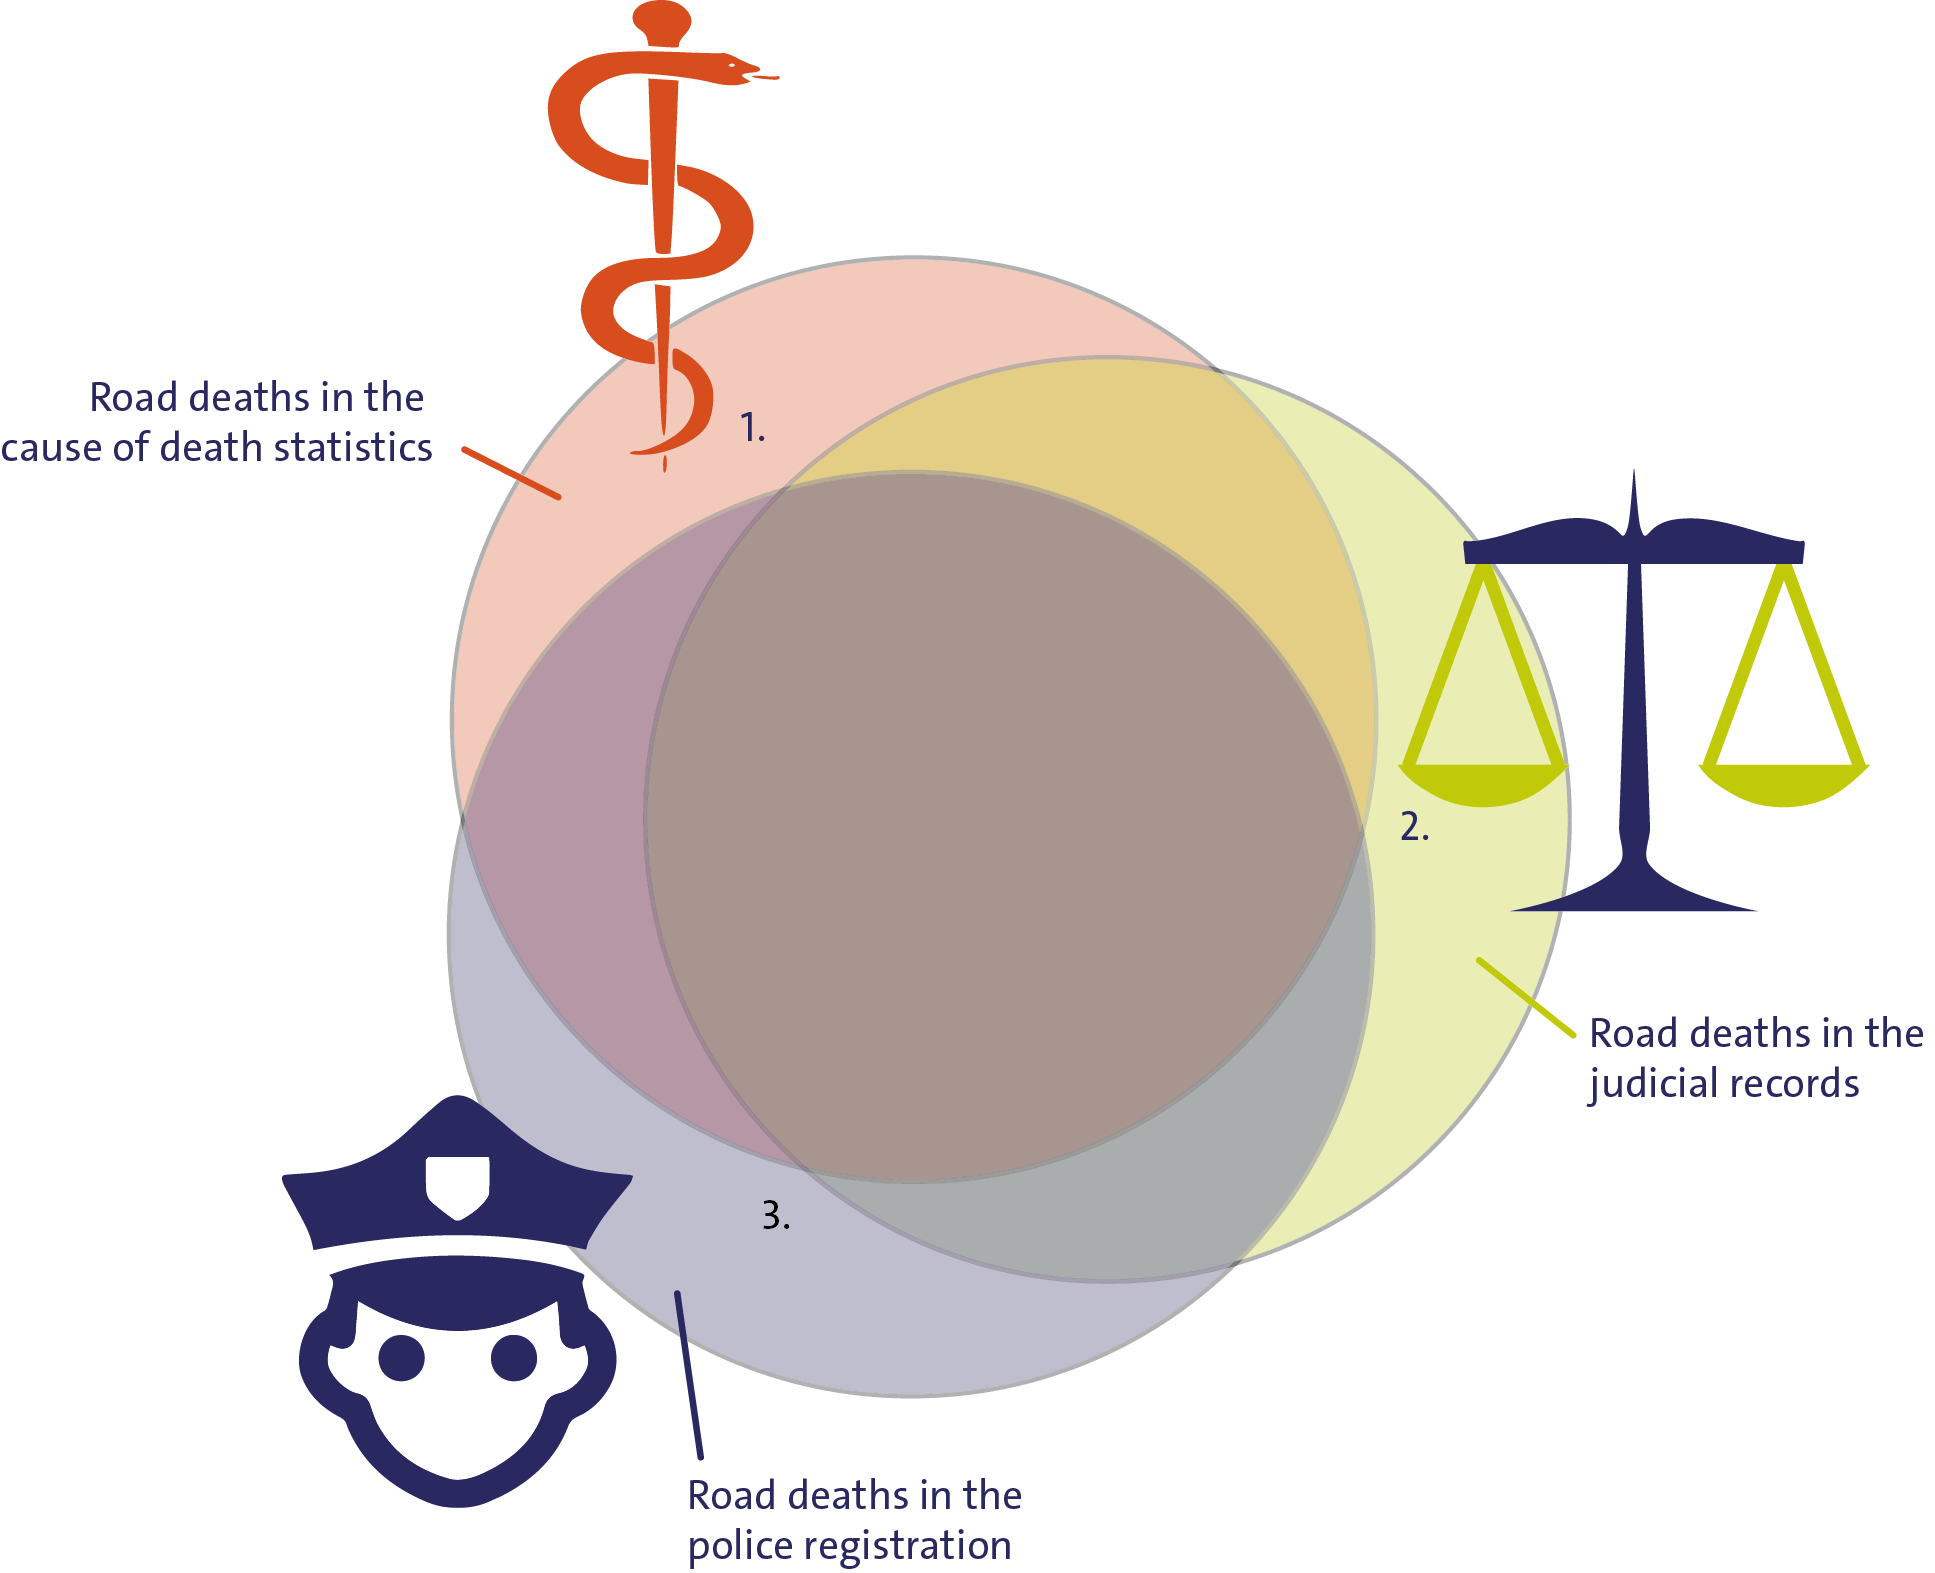
[3]. KiM (2019). Mobiliteitsbeeld 2019. Kennisinstituut voor Mobiliteitsbeleid (KiM), Den Haag.

[4]. Schoeters, A., Large, M., Koning, M., Carnis, L., et al. (2021). Wat is de monetaire waardering van het voorkomen van verkeersdoden en ernstig verkeersgewonden? Een overzicht van de resultaten van de VALOR-studie. 2021-R-01-NL. Vias Institute, Brussel.

[5]. Ministerie van VenW (2008). Strategisch Plan Verkeersveiligheid 2008-2020; Van, voor en door iedereen. Ministerie van Verkeer en Waterstaat, Den Haag.

[6]. Aarts, L., Wijlhuizen, G.J., Gebhard, S., Goldenbeld, C., et al. (2021). De Staat van de Verkeersveiligheid 2021. Doelstellingen voor 2020 definitief niet gehaald – hoe nu verder? R-2021-21. SWOV, Den Haag.

[7]. Weijermars, W., Schagen, I. van & Aarts, L. (2018). Verkeersveiligheidsverkenning 2030. Slachtofferprognoses en beschouwing SPV. R-2018-17. SWOV, Den Haag.

[8]. Council of the European Union (2017). Council conclusions on road safety: endorsing the Valletta Declaration of March 2017. Outcome of Proceedings from the General Secretariat of the Council. 9994/17 / TRANS 252 / 8666/1/17 REV 1 TRANS 158. Council of the European Union, Brussels.

[9]. United Nations (2020). Improving global road safety. A/74/L.86. United Nations, New York.

[10]. Tweede Kamer (2021). Motie van het lid Geurts over een halvering van het aantal verkeersslachtoffers in 2030. Maatregelen verkeersveiligheid 29 398, nr. 946. Tweede Kamer der Staten-Generaal, Den Haag.

[11]. Adminaité-Fodor, D., Carson, J. & Jost, G. (2021). Ranking EU progress on roadsafety. 15th Road Safety Performance Index Report. European Transport Safety Council ETSC, Brussels.

[12]. ITF (2021). Road safety annual report 2021: The impact of Covid-19. OECD Publishing, Paris.

[13]. Adminaite, D., Jost, G., Stipdonk, H. & Ward, H. (2020). The impact of COVID-19 lockdowns on road deaths in April 2020. ETSC PIN Briefing. European Transport Safety Council ETSC, Brussels.

[14]. EC (2022). Road safety in the EU: fatalities in 2021 remain well below pre-pandemic level. News Article, 28 March 2022. European Commission, Brussels. Accessed on 13-04-2022 at ec.europa.eu/transport/road_safety/news-events/news/road-safety-eu-fatalities-2021-remain-well-below-pre-pandemic-level-2022-03-28_en

[15]. Adminaite, D., Jost, G., Stipdonk, H.L. & Ward, H. (2018). An overview of road death data collection in the EU. PIN Flash report 35. European Transport Safety Council ETSC, Brussels.

9 + 0 =
Solve this simple math problem and enter the result. E.g. for 1+3, enter 4.
Afbeelding FS Verkeersdoden

Would you like to cite this fact sheet?

SWOV publication

This is a publication by SWOV, or that SWOV has contributed to.