Fatality risk can be expressed as the number of road deaths per km travelled. Fatality risk is highest for powered two-wheelers: (light) moped riders and motorcyclists, about thirty times higher than the risk for car occupants (Figure 10). For cyclists and pedestrians, the risk is eight and six times higher than the death risk for car occupants, respectively, over the 2012-2021 period.
Figure 10 shows two-year averages known for 2012-2021 [i], since the annually calculated risks are to some extent coincidental due to uncertainties in exposure data and numbers of crashes. Most strikingly, the fatality risk for car occupants remained more or less the same over that period, but increased for two-wheelers certainly in the more recent years, and decreased for pedestrians.
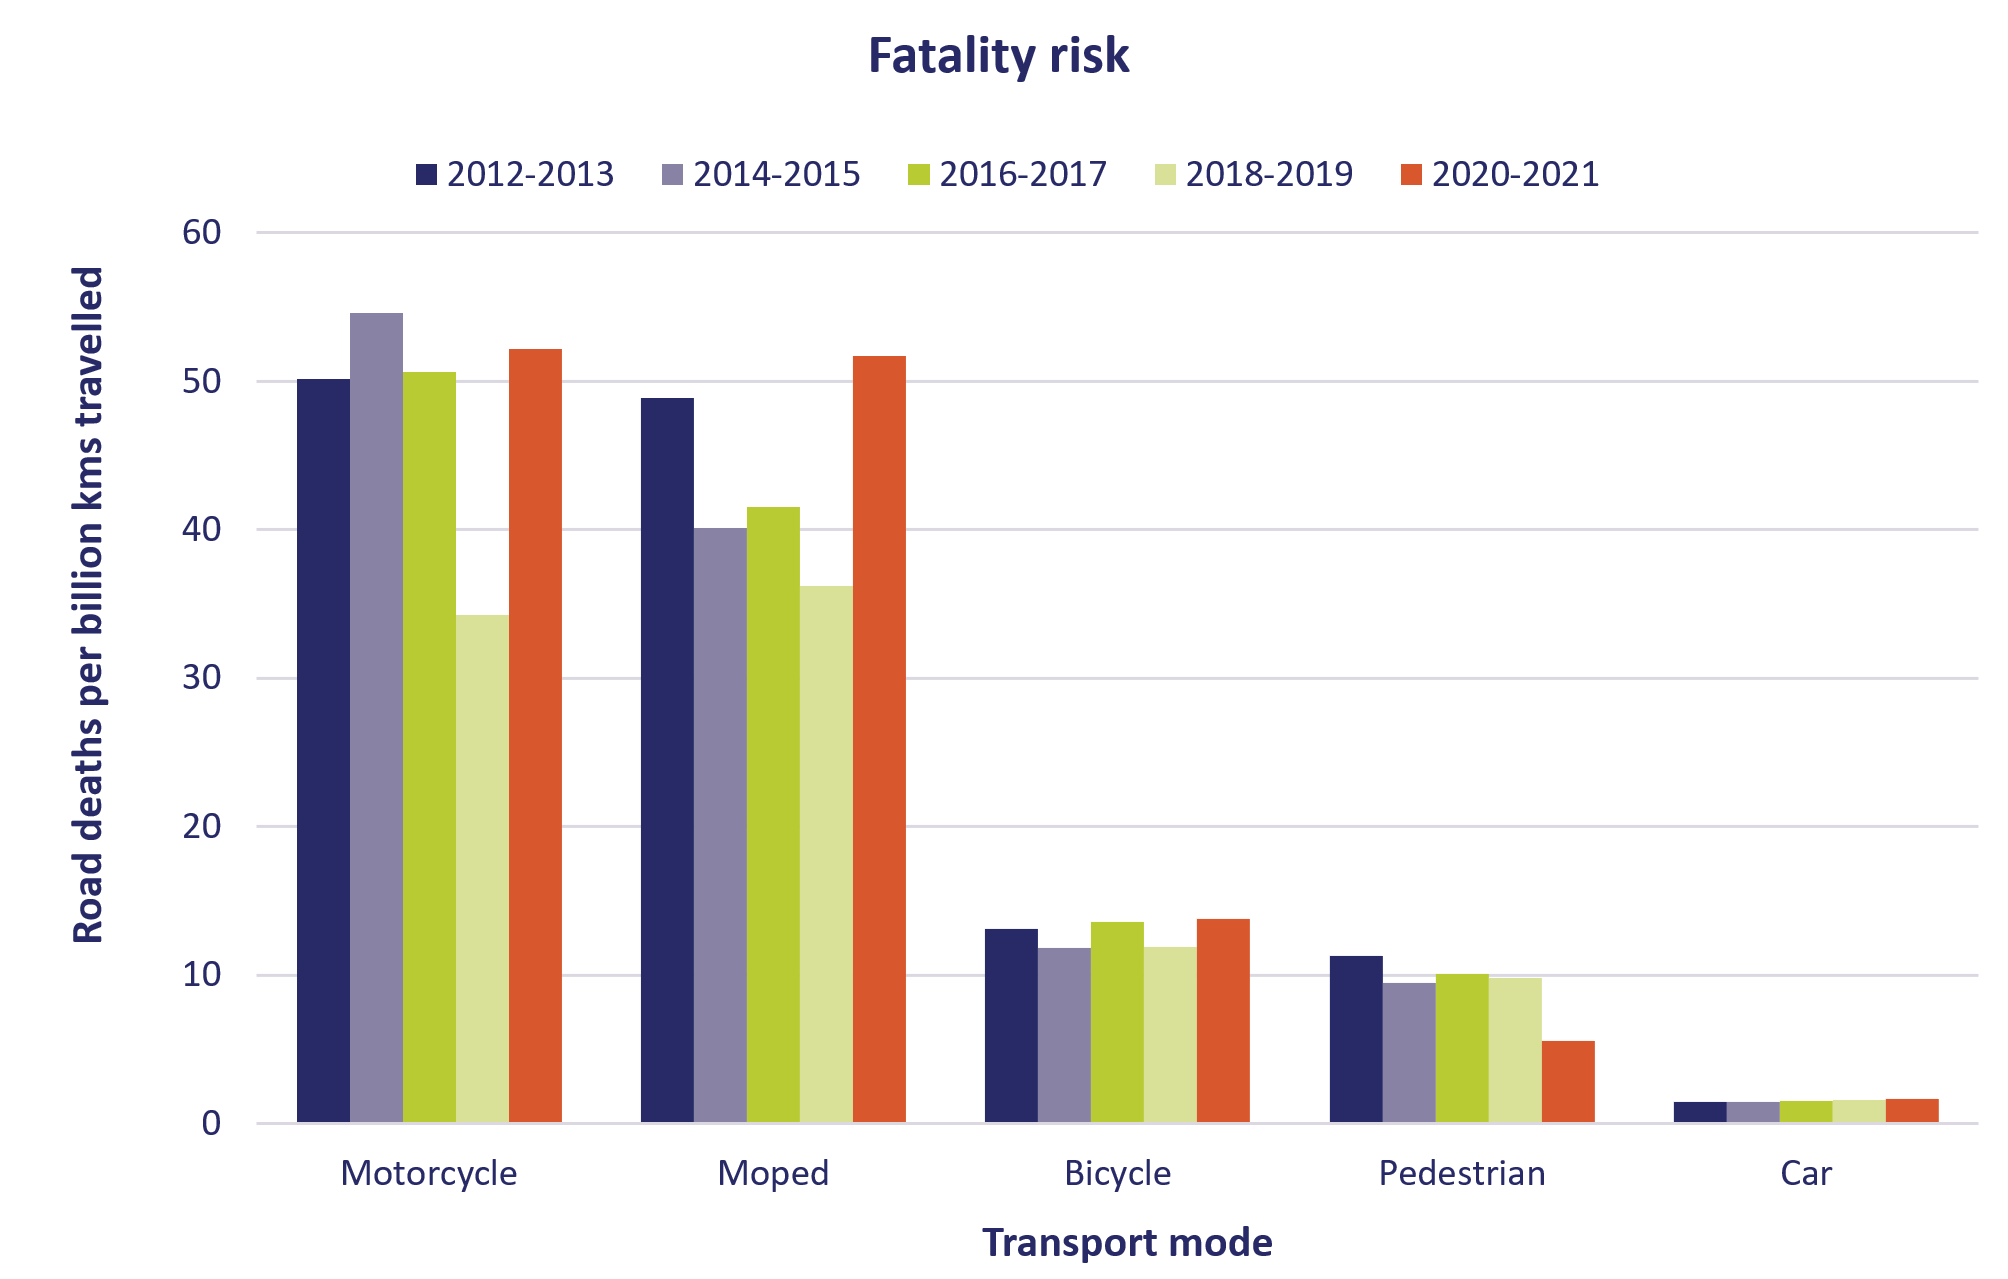
Figure 10. Fatality risk (number of road deaths per kilometre travelled) in the Netherlands, for various modes of transport, averaged over two-year periods. Sources: Statistics Netherlands (Road Death Statistics, Dutch Travel Survey (OViN)), On the Road in the Netherlands (ODiN), IenW (Mobility Research Netherlands (MON), adapted by SWOV.
[i] Once the data for the 2023 risk calculations are complete, we will add 2022 and 2023.