It is known that 47% of the road deaths resulted from a road crash outside the urban area and 42% from a road crash in the urban area (Figure 6). For the remaining 11%, the crash location is not known because location data are only available in BRON and are therefore known only for those road deaths that are registered in BRON. However, not all road deaths are registered in BRON (see the question How is the number of road deaths in the Netherlands determined?). In 2023, 77 (11%) of the 684 real road deaths (according to Statistics Netherlands) are missing from the BRON database, so we do not know where these 77 crashes occurred.
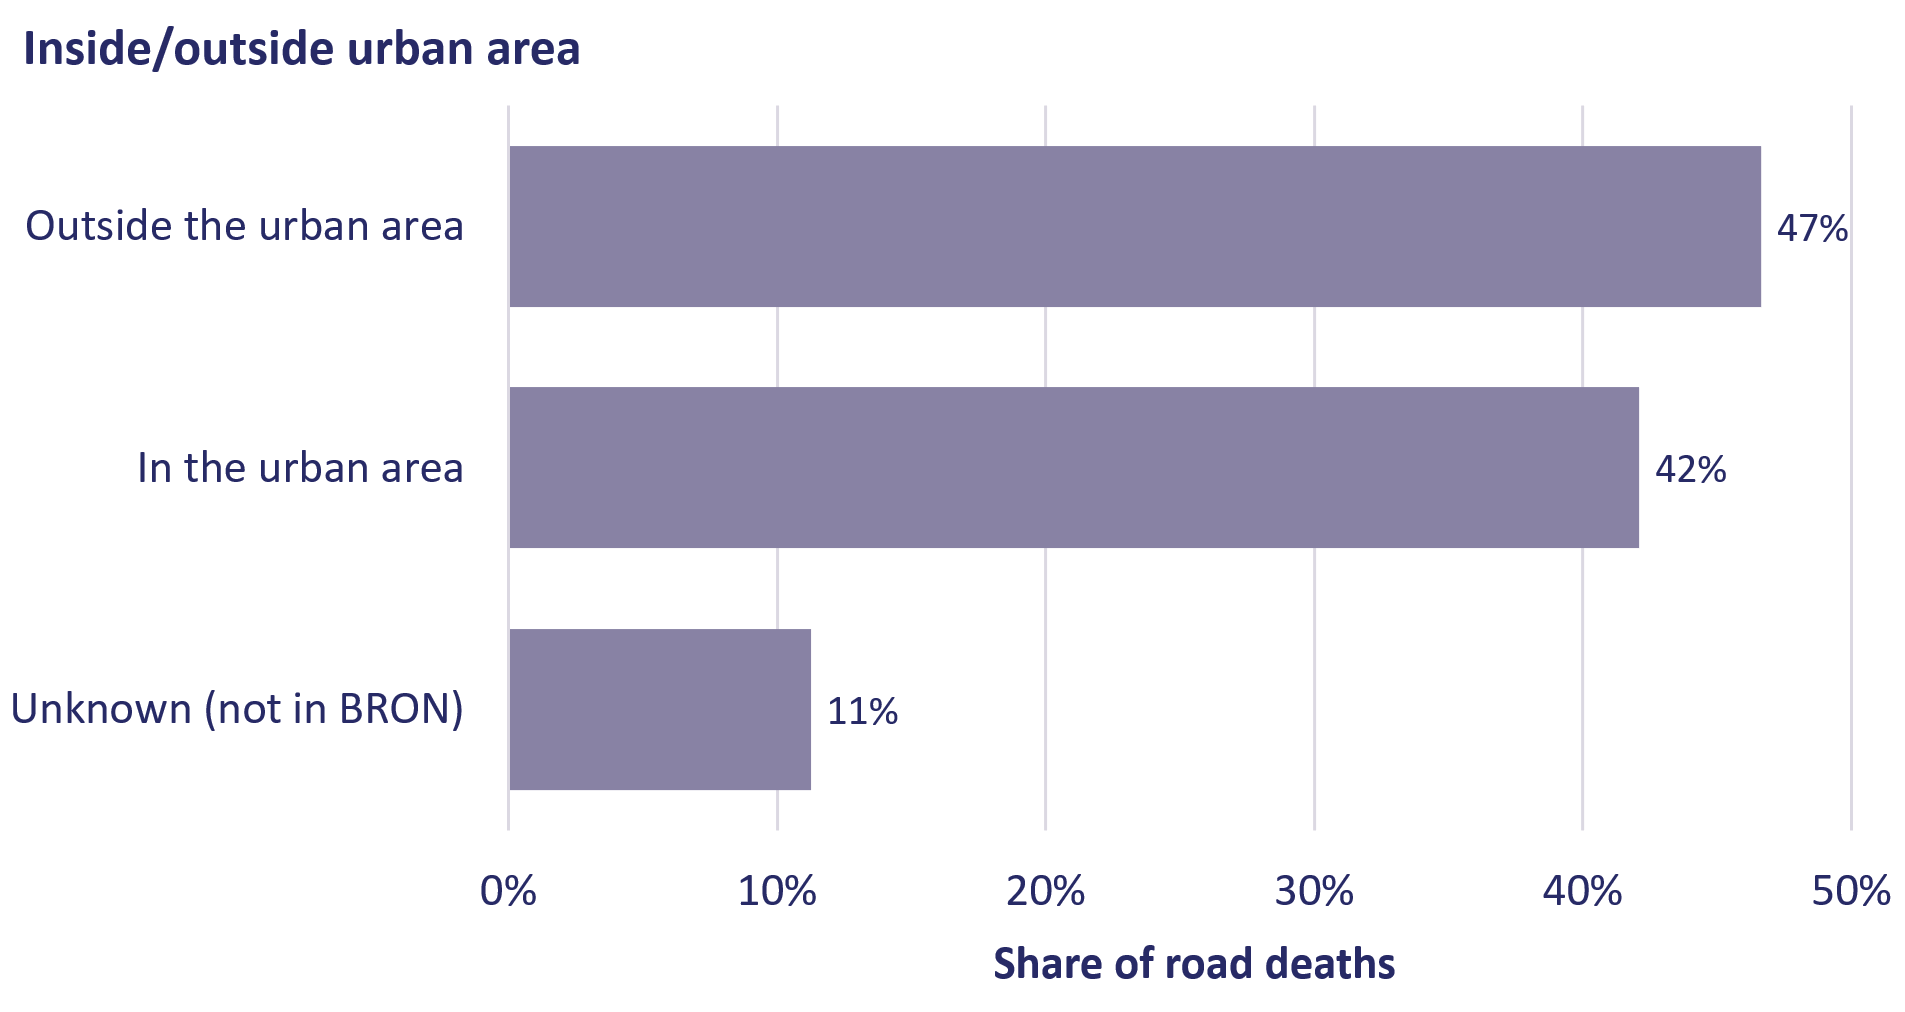
Figure 7 shows the number of road deaths by speed limit. The largest share of road deaths occurs on 50km/h and 80km/h roads (29% and 18%, respectively, of the total number of road deaths). On 60km/h roads, the share of road deaths is also substantial, that is: 17% of the road deaths. On 30km/h roads or roads with lower speed limits, the share is 11% of the total number of road deaths. Finally, on roads with a speed limit of 100, 120 or 130 km/h, the share amounts to 9% of the number of road deaths. Of the remaining road deaths, the crash location or the speed limit at the scene of the accident is not known.
In 2023, 58% of the total number of road deaths occurred on road sections and 30% at intersections (see Figure 8).
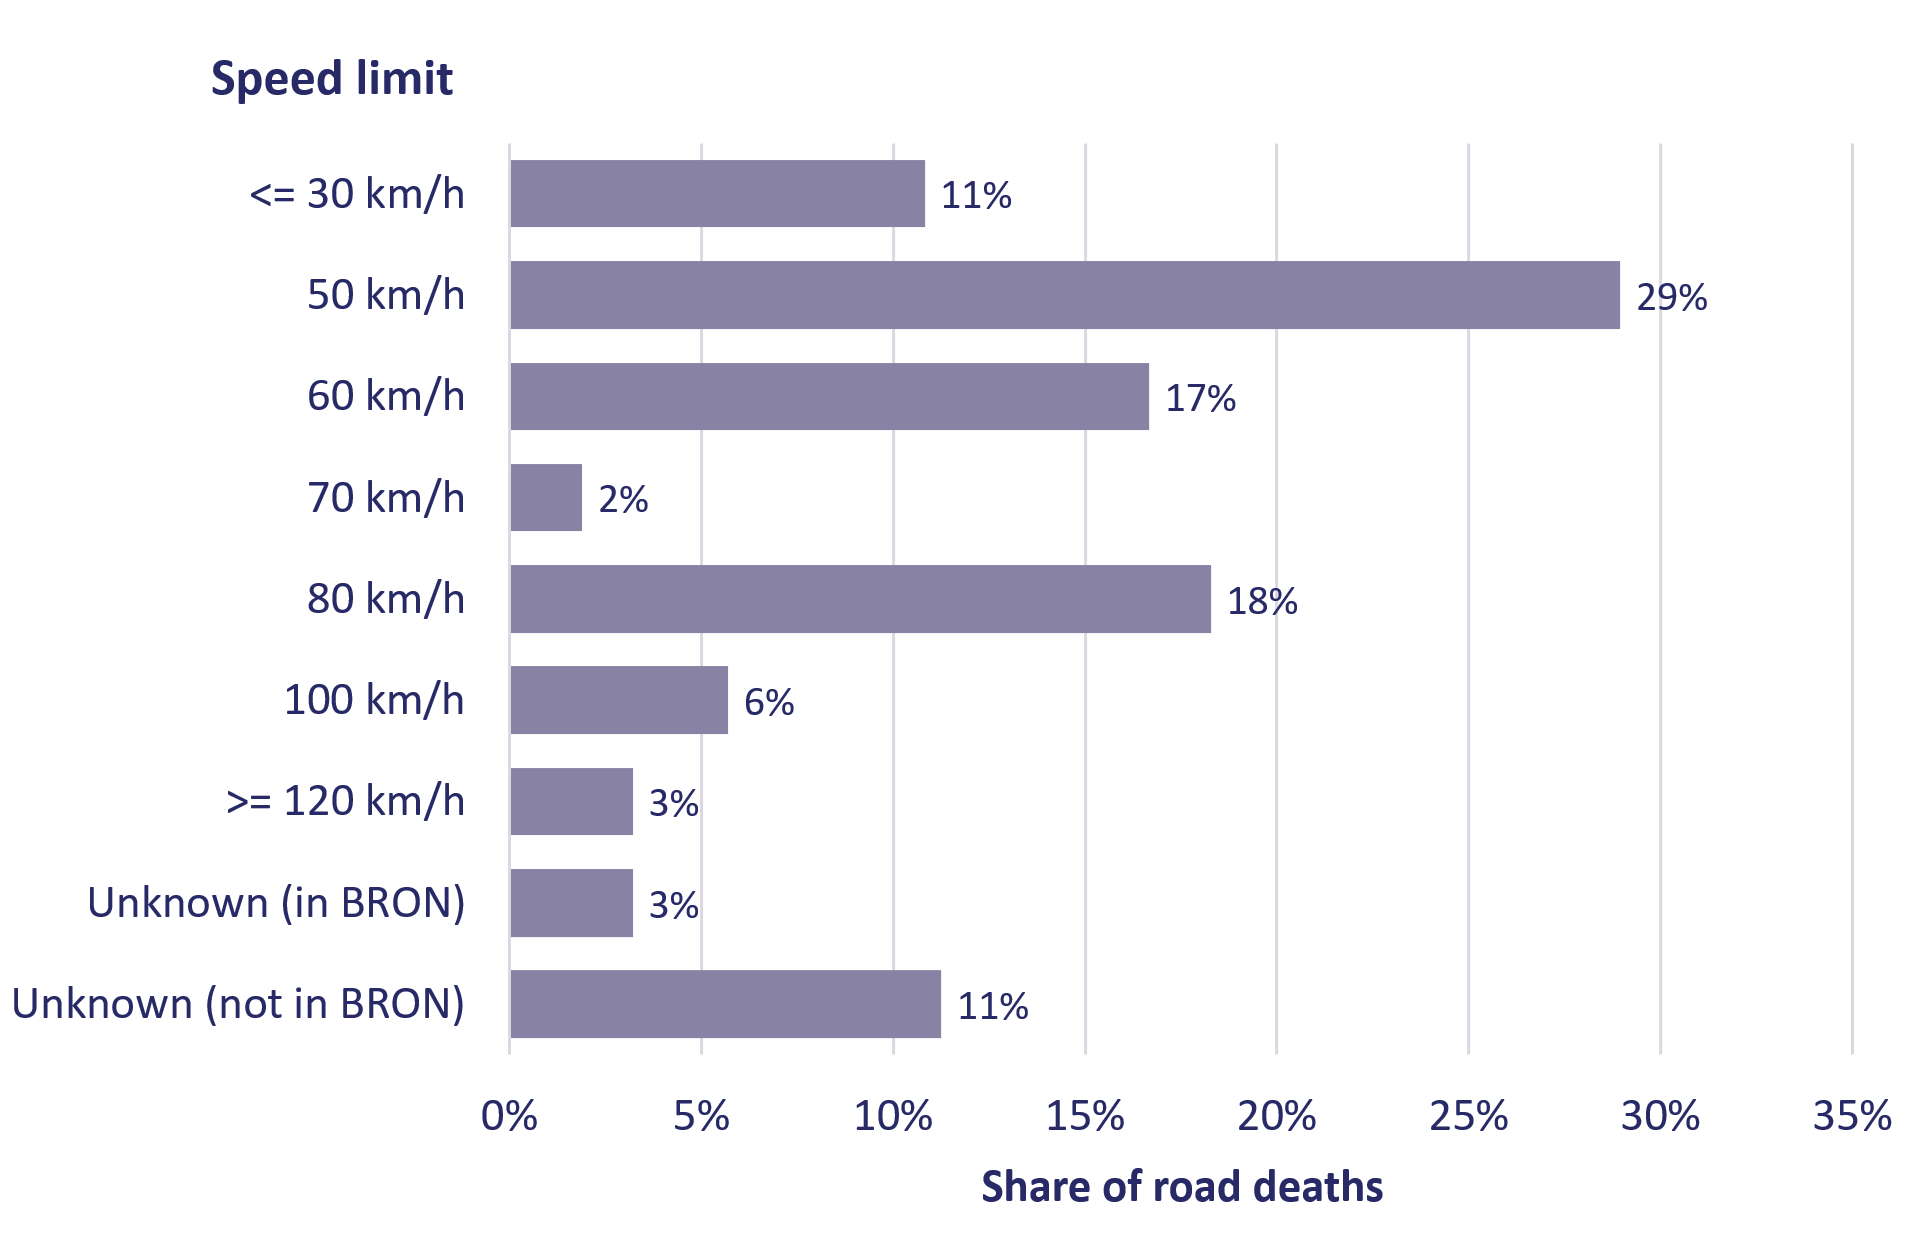
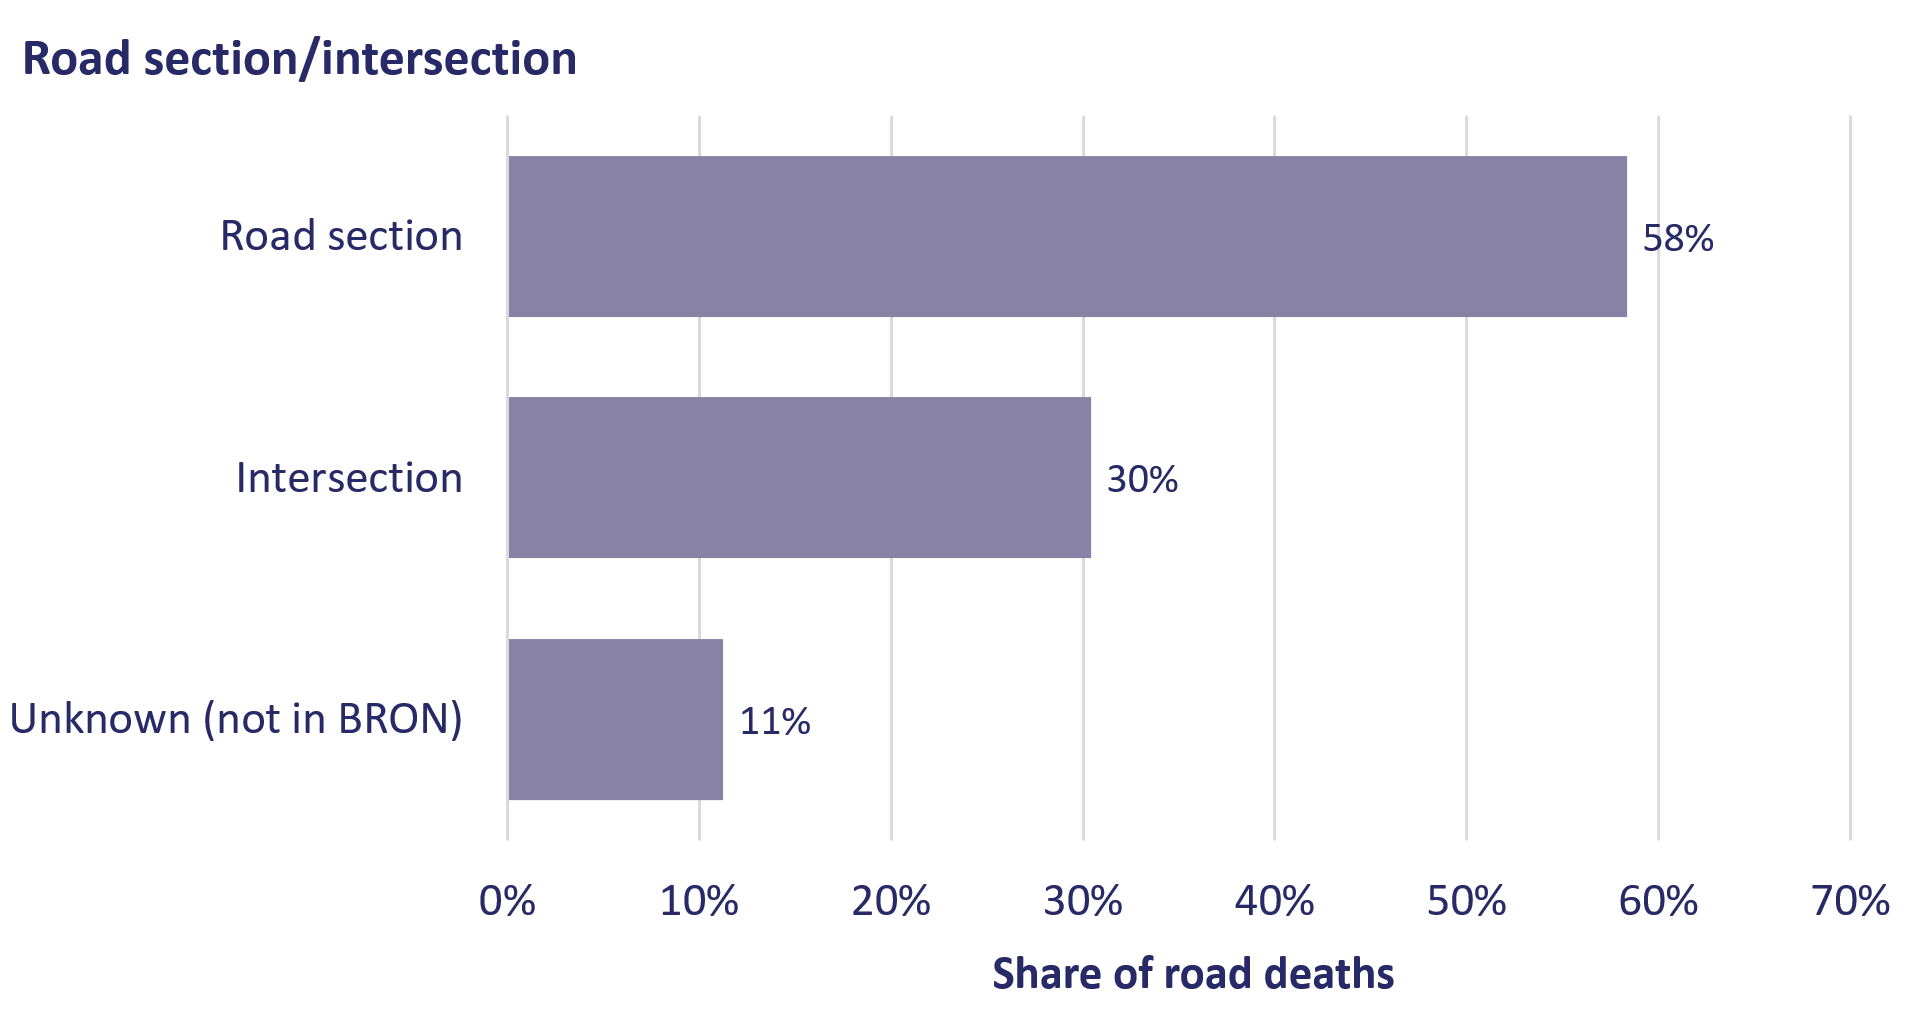
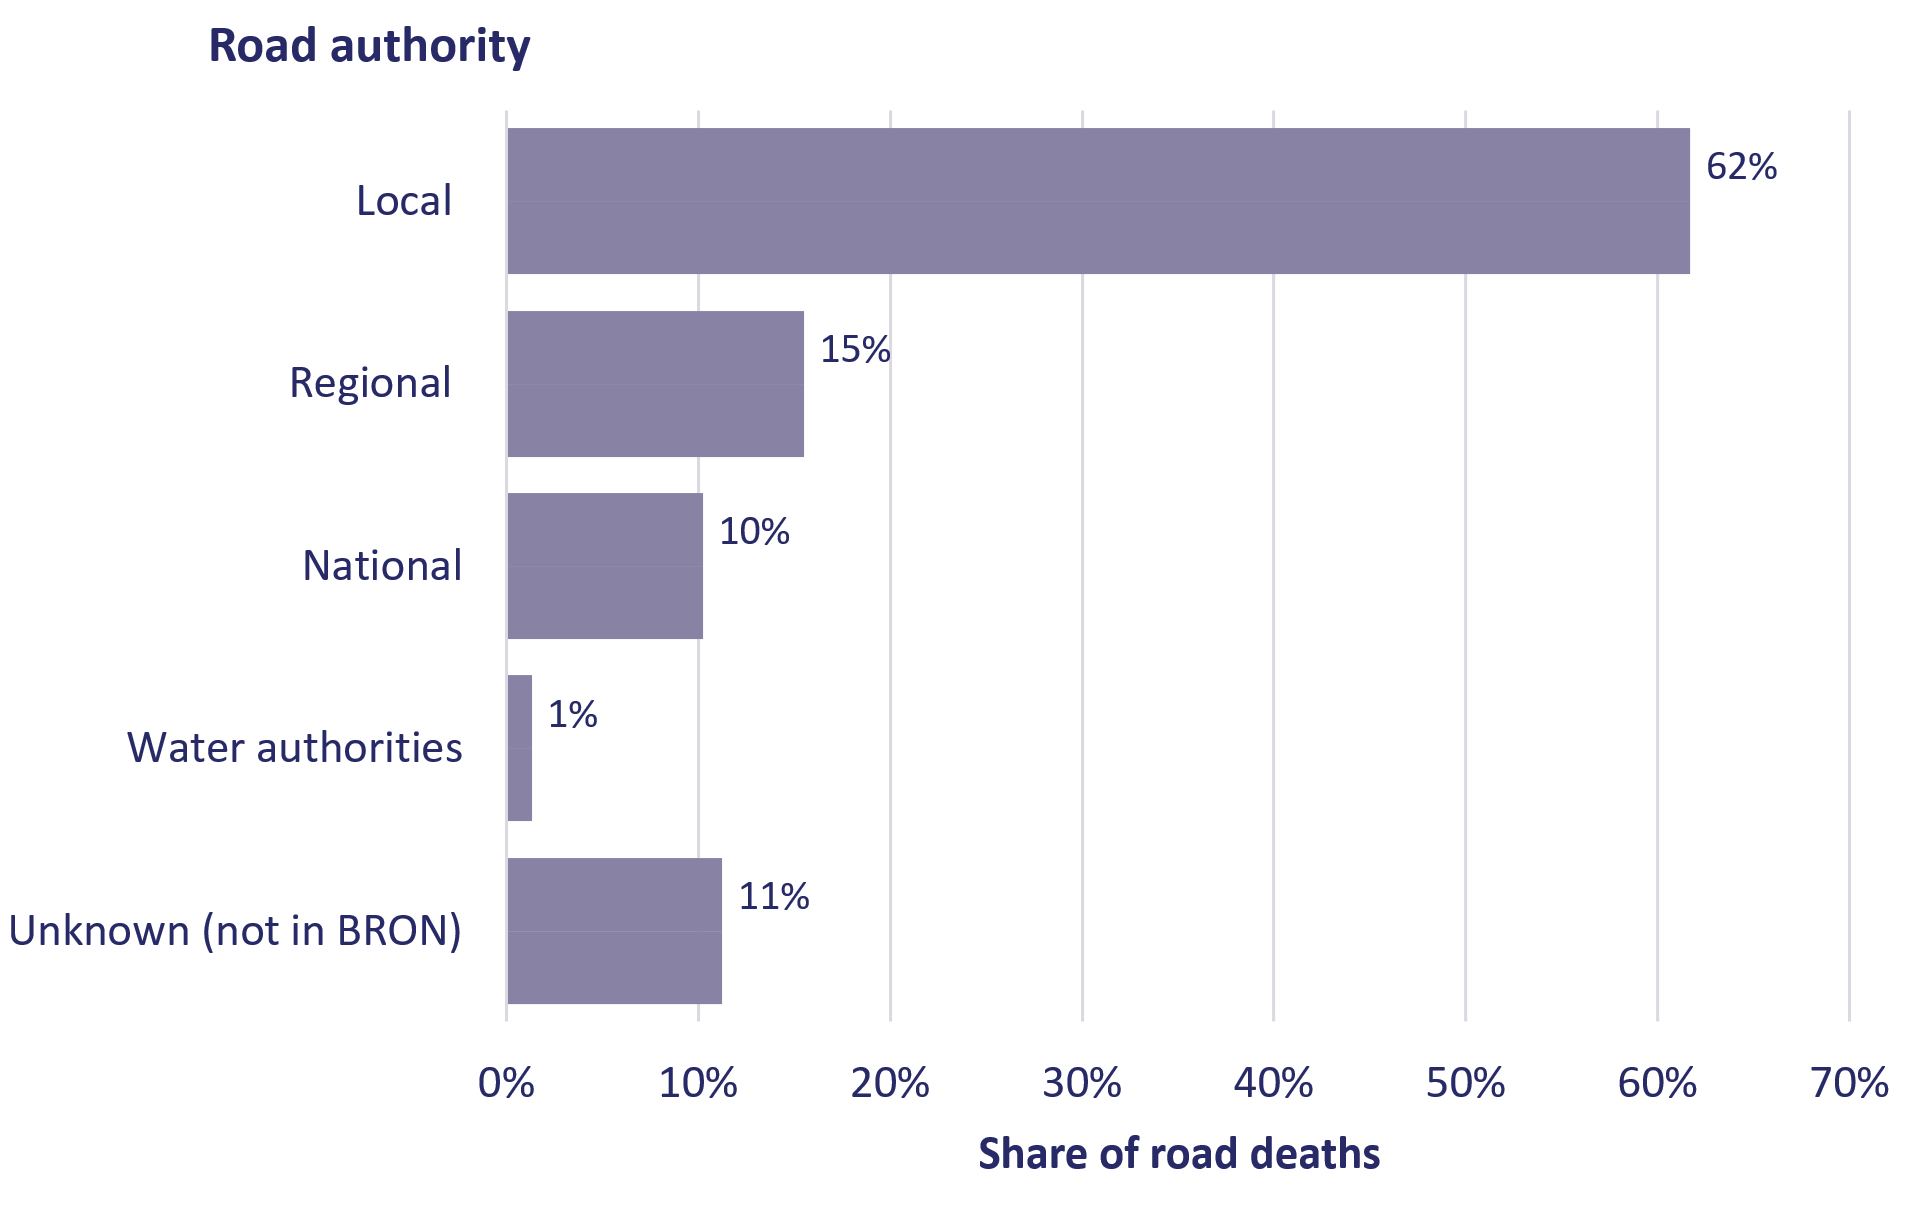
Figure 9 shows the 2023 shares of road deaths by road authority. The largest share of road deaths in the Netherlands occurs on municipal roads (62% of the total number of road deaths, followed by regional roads (15% of the total number) and national roads (10% of the total number). The smallest number of road deaths occurs on roads managed by the remaining road authorities, such as water authorities (1% of the total number). These shares not only reflect the degree of hazard on these roads, but also and particularly the number of roads and the amount of traffic on these roads.