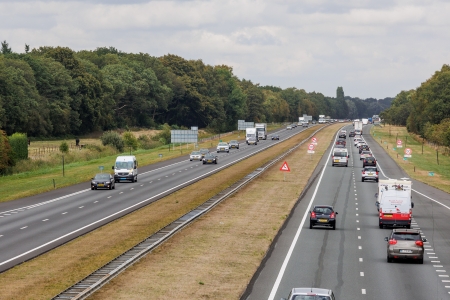
Safe roadsides

Updated

Roadsides or verges can play an important role in crash circumstances or outcomes. Every year, about 140 fatal 'run-off-road crashes' involving motor vehicles (excluding two-wheelers) are registered in the Netherlands: they result in around 160 road deaths, more than a quarter of the total number of road deaths. Cyclists can also have run-off-road crashes. Of the cyclists treated at an A&E department (Accident & Emergency), it is estimated that about 20% were involved in a run-off-road crash.

Most road crashes involving motor vehicles occur on 60- and 80km/h roads. Young road users (aged 15-24) are relatively often involved in run-off-road crashes. The most important measure to make roadsides safer is to remove or safely shield obstacles in the prescribed clear zone. A median with a safe shielding structure is another important measure. It may prevent vehicles from ending up on the opposite side of the road. This factsheet provides information on characteristics of run-off-road crashes and on infrastructure and vehicle measures that may prevent run-off-road crashes and/or reduce their consequences.

What do we mean by a run-off-road crash?

We call a crash a run-off-road crash if the roadside played a significant role in crash circumstances or outcome. Run-off-road crashes can be single-vehicle crashes that occur on the roadside and do not involve other road users, but also multiple-vehicle crashes in which a vehicle slips onto the roadside after a crash with another vehicle and collides with an obstacle. Crashes in which a vehicle goes off the road, then back onto the road colliding with another road user can also be described as roadway departure crashes, of which run-off-road crashes are a subgroup.

Most run-off-road crashes are single-vehicle crashes. Run-off-road crashes typically end when a vehicle hits an obstacle, overturns or hits the water. In this fact sheet, the focus is on run-off-road crashes. Other types of roadway departure crashes are not considered.

How often do run-off-road crashes occur?

In 2016-2020 [i], an average of 142 fatal run-off-road crashes involving motor vehicles (excluding two-wheelers) were recorded annually, resulting in an average of 157 road deaths (BRON). This represents over a quarter of all fatal crashes and road deaths in the Netherlands, as shown in Table 1. Some of the run-off-road crashes concern vehicles that ended up in the water. This category is also discussed separately in SWOV fact sheet Submerged vehicle crashes. Recent numbers of run-off-road crashes with injuries only and numbers of road injuries as a result of run-off-road crashes cannot be properly determined due to the under-registration of these crashes in BRON.

tabel

Table 1. Fatal run-off-road crashes involving motor vehicles (excluding motorised two-wheelers) - an estimate based on crashes in BRON with crash type: 'single-vehicle', 'loose object' or 'fixed object'

Cyclists and other two-wheelers can also have run-off-road crashes. However, these have not been included in Table 1 as it is harder to determine whether these road users were indeed involved in run-off-road crashes [ii]. For cyclists, however, the share of run-off-road crashes has been estimated based on the Injury Information System [1]: about 20% of the A&E-treated cyclists turned out to have had a run-off-road crash. These are cycling crashes in which cyclists rode onto the roadside and/or hit a kerb and fell as a result.


[i] At the time of writing this fact sheet, these were the most recent data.

[ii] The number of run-off-road crashes was estimated based on crashes in BRON with crash type 'single-vehicle', 'loose object' or 'fixed object'. In the case of cycling crashes, single-vehicle crashes can also include road falls and crashes involving mounting and dismounting, and in addition, the number of cycling crashes not involving a motor vehicle is rather under-reported in BRON.

When and where do most run-off-road crashes occur?

About three quarters of fatal run-off-road crashes involving motor vehicles (excluding two-wheelers) occur outside urban areas. Broken down by speed limit, most fatal run-off-road crashes occur on 80km/h roads (29% of the total number of run-off-road crashes involving motor vehicles) and 60km/h roads (27%). Motorways and 50km/h roads both account for about 15% of the total number of run-off-road crashes involving motor vehicles.

Within the category of road types with a given speed limit, the share of run-off-road crashes is highest on 130km/h roads and on 60km/h roads. On both road types, 46% of fatal crashes are run-off-road crashes involving motor vehicles.

According to BRON, most fatal run-off-road crashes involving motor vehicles (excluding two-wheelers) occur on straight roads (see Table 2). Over a quarter (26%) of run-off-road crashes occur in curves. This share is relatively high as only a small proportion of roads are 'curves'. In fact, two in-depth studies of run-off-road crashes in the Netherlands found that about half of them occur in or just after a curve [2] [3] [4].

Tabel

Table 2. Annual number of fatal run-off-road crashes involving motor vehicles (excluding two-wheelers), averaged over 2016-2020 by road situation. Source BRON.

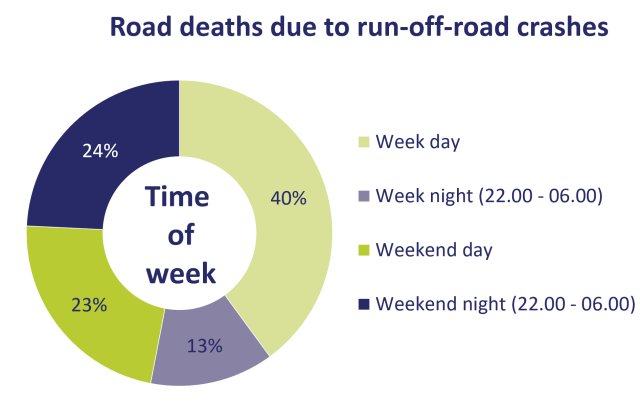
The majority of serious run-off-road crashes occur at weekends [4] [5]. Almost half of the road deaths in run-off-road crashes involving motor vehicles (excluding two-wheelers) occur at weekends (47%) and almost a quarter (24%) on a weekend night (BRON). In comparison: for all road deaths in crashes involving motor vehicles (excluding two-wheelers), the figures are 37% and 18% respectively.

Figure 1. Road deaths due to run-off-road crashes involving a motor vehicle (excluding two-wheelers), by time of week/day in 2016-2020. Source: BRON.

Which road users are most often involved in run-off-road crashes?

Young road users aged 15-24 are relatively often involved in fatal run-off-road crashes (see Figure 2). Almost 30% of the road deaths due to run-off-road crashes involving motor vehicles (excluding two-wheelers) are young road users, while 15% of all road deaths are aged 15-24. Within the age group of young road users, 76% of all young road deaths in crashes involving motor vehicles (excluding two-wheelers) occur in run-off-road crashes. This is relatively high when compared to other age groups. Among adults (aged 25-69) and older road users (over-70s), this is the case for 55% and 47% of road deaths, respectively.

At 16%, older road users (over-70s) constitute a limited group of road deaths in run-off-road crashes involving motor vehicles (excluding two-wheelers; see Figure 2). Within the older age group, almost half of the road deaths (47%) involve run-off-road crashes (in crashes involving motor vehicles, excluding two-wheelers, in 2016-2020).

Younger road deaths (aged 15-24) in run-off-road crashes involving motor vehicles (excluding two-wheelers) occur relatively often (37%) on weekend nights (on Friday to Sunday 22:00 - 6:00). This is also seen in other types of fatal road crashes involving young people (see SWOV fact sheet Young road users (teenagers and adolescents)). Young road users (teenagers and adolescents)). Conversely, of the older road deaths (over-70s) in these types of run-off-road crashes, most (62%) occurred during the day on weekdays. About a quarter of the older road deaths (26%) occurred during the day at weekends.

Figure 2. Road deaths due to run-off-road crashes involving motor vehicles (excluding two-wheelers), broken down by age group in 2016-2020. Source BRON.

Most road deaths in run-off-road crashes (involving motor vehicles, excluding two-wheelers) were car occupants: 89%. About 8% were delivery van occupants. The share of cyclists among those killed in run-off-road crashes is not known; see the question How often do run-off-road crashes occur?

Which types of run-off-road crashes can be distinguished?

The main distinction in run-off-road crashes is whether or not drivers lose control of their vehicles. When control is lost, the vehicle skids. Studies from Australia and New Zealand show that drivers that have lost control enter the roadside at a greater angle, and have a significantly larger encroachment of lateral displacement on the roadside than drivers that have maintained control. Cars that have skidded, go beyond the clear zone (see the question What does a safe roadside (or outer verge) look like?), as is shown in simulations [6] [7]. In run-off-road crashes where control is maintained, the angle of entry is limited; in most cases, these cars stay within the clear zone [6] [7] [8]. Thus, if the roadside is provided with the desired clear zone, drivers are more likely to come to a stop safely on the roadside or to correct their course when control is maintained.

It is not known what share of run-off-road crashes in the Netherlands involves loss or retention of control. However, in-depth research into fatal crashes on national roads shows that a relatively large share (more than 15% in 2015-2019) of road deaths due to run-off-road crashes resulted from a collision with an obstacle outside the clear zone [9]. These road deaths could therefore have involved loss of control.

What are the causes of run-off-road crashes?

The occurrence - and also the outcome - of run-off-road crashes is determined by several factors, and often by a combination of them. We distinguish human factors, infrastructure factors and 'general' factors such as temporary conditions.

Human factors

Human factors concern driver behaviour, fitness to drive and driver state. The following human factors play a role in the occurrence of run-off-road crashes [2] [10] [11] [12] [13] [14] [15] [16] [17]:

  • Driving speeds that are too high in the given circumstances;
  • fatigue;
  • use of alcohol or drugs;
  • distraction or inattention;
  • incapacitation.

In addition, human factors also play a role in the outcome of run-off-road crashes. We know that a higher driving speed in a collision leads to a higher impact and a higher risk of serious injury (See  SWOV fact sheet Speed and speed management). Seatbelt use also proves to be important for the outcome. Of the road deaths among car occupants in run-off-road crashes in the province of Noord-Brabant in 2018-2019, almost half (26 out of 57) were shown not to have used a seatbelt [16]. Of all car occupants, only 4% do not wear seatbelts [18]. Thus, fatality risk is significantly higher when no seatbelt is worn.

Infrastructure factors

Flaws in road and roadside design play a role in both the occurrence and outcome of run-off-road crashes. In-depth studies often reveal the following infrastructure crash factors [2] [3] [11] [12] [13] [14] [15] [16] [17]

  • confined clear zones;
  • steep side slopes;
  • poorly designed shielding structures;
  • too small hard strips or narrow paved shoulders;
  • tight curves.

An unshielded obstacle too close to the road is the main infrastructure crash factor. Obstacles include trees, ditches, gantries or guard rails with poorly designed ends[10] [19] [20]. On roads with obstacles close to the road, the risk of a run-off-road crash is estimated to be about twice as high [8] [9]. A too narrow hard strip increases the risk that vehicles that have drifted off the lane will also drift off the road due to less space (and time) to redirect the vehicle and return to the lane.

Another important crash factor is an (unexpectedly) tight curve. The risk of a run-off-road crash increases sharply as a curve become tighter [21] [22]. Furthermore, predictability is also important: an unexpectedly sharp curve makes it more likely that drivers will enter it at too high speed [4] [23].

General factors

(Temporary) conditions such as a wet road surface or darkness may also contribute to the occurrence of run-off-road crashes [4] [5]. Incidentally, the crash factor 'darkness' does not always necessarily contribute to run-off-road crashes in the dark. After all, crashes caused by risky driving behaviour relatively often occur in the dark as well [2].

What does a safe roadside (or outer verge) look like?

A safe roadside is designed to prevent run-off-road crashes, or at least those with a serious outcome. A safe roadside allows vehicles that have drifted off the lane to be steered back into the lane in a controlled manner, to come to a safe stop on the roadside, or to be protected by a shielding structure designed to prevent serious injury. A safe roadside is 'forgiving'. In addition, road users should not be distracted by advertising or other objects on the roadside (see SWOV fact sheet Distraction in traffic.

Forgiving roadside

Firstly, a safely designed roadside has a sufficiently wide emergency lane or narrow paved shoulder, so that a run-off-road crash is prevented as far as possible. A narrow paved shoulder or hard strip is intended to allow drivers to return to the lane (if they are still in control of the vehicle, see the question Which types of run-off-road crashes can be distinguished?. An emergency lane is wider, and is also intended for use as a refuge in case of an emergency or breakdown.

Secondly, a safe roadside is designed such that drivers who have hit the roadside do not lose control of their vehicles. This is particularly relevant for run-off-road crashes in which the driver has maintained control of the vehicle (see the question Which types of run-off-road crashes can be distinguished?). A safe roadside therefore has the smallest possible difference in level between the carriageway (road surface) and the roadside. Ideally, there should also be a (unpaved) semi-hardened shoulder next to the carriageway: grass-concrete bricks, plastic mats or stone mixtures whose appearance differs markedly from the carriageway. A semi-hardened shoulder makes it easier to control the vehicle and increases the likelihood of the driver steering the vehicle back to the road or stopping it safely. At the very least, the entire roadside is load-bearing so that the wheels do not sink into it.

Third, but no less important, a safe roadside has a sufficiently wide clear zone and/or shielding structure to prevent crashes with a serious outcome. The safest design is a clear zone combined with a shielding structure at its end, at some greater distance along the road [8]. See Figure 3.

Cross section of a road with a lane, recovery area, semi hardened shoulder and shielding structure
Figure 3. Cross section of a safely designed roadside.

Clear zone

The obstacle-free zone or clear zone is the area along the road in which there should be no hazards or obstacles that could cause serious damage or injury in case of a crash [24]. Hazards include, for example, trees, gantries and ditches. Side slopes, for example, may be present within the clear zone, provided they are not too steep, as well as so-called 'crashworthy' road furniture.

The prescribed width of the clear zone depends on the speed limit or design speed of the road: 2.5 metres at 60km/h, 6 metres at 80km/h, 10 metres at 100km/h and 13 metres at 120km/h as the speed limit. For roads with a speed limit of 130km/h, the design speed is 120km/h.

Shielding structure

A roadside shielding structure, (cable)barrier or guardrail, has the following safety characteristics:

The shielding structure is flexible.
Flexible shielding structures imply that road users experience reduced forces to the body when crashing with the structure. The most flexible are cable barriers. Guard rails can also be reasonably flexible. Concrete barriers are in general the least flexible and therefore not forgiving [9] [20].

There are no obstacles or objects within the 'working width'.
The working width is the degree to which the shielding structure deflects transverse to the driving direction during a crash. If an obstacle or any other object is too close to the shielding structure, a crash may have a serious outcome.

The shielding structure is outside the emergency/recovery zone.
This way, there is room for vehicle breakdowns, and for drivers to safely steer back or stop their vehicles if necessary. A vehicle is also less likely to bounce back onto the carriageway. Finally, this provides space (to make way) for emergency services.

The shielding structure starts well ahead of the obstacle.
If, in the longitudinal direction, the shielding structure starts 'too late' (too near the object), a vehicle may overshoot the structure and still crash with the obstacle [15].


The starting points of the shielding structure are safely designed.
Starting points (called end points) should be fitted with a forgiving terminal or possibly crash cushion and - in the case of a terminal - can additionally be 'flared'. When flared, it is important that the shielding structure enters the roadside at the correct angle and length [15].

What does a safe median look like?

A safe median should prevent vehicles from ending up on the opposite side of the road and crashing head-on with oncoming traffic. This is particularly important when the driving speed of motor vehicles is above 70 km/h (see SWOV fact sheet Sustainable Road Safety). In addition, the median should be designed in such a way that 1) a vehicle that drifts (left) from the lane can be steered back into the lane in a controlled manner, and 2) the severity of crashes that can no longer be prevented is limited by a flat, sufficiently load-bearing roadside without unshielded obstacles. For further explanation, see the question What does a safe roadside (or outer verge) look like?

Many rural medians are relatively narrow and fitted with guard rails. Such medians are safe if the guard rails are forgiving and if - on roads with more lanes in each driving direction  – they are positioned outside the so-called recovery zone. This is a surfaced lane to the left of the leftmost lane with a preferred width of 2.5 metres, intended to allow a vehicle to come to a stop in case of emergency. The median - behind the guard rails - should provide sufficient space for vehicle occupants to find a relatively safe haven.

Safe medians without guard rails or other shielding structures, but with, for example, a ditch, have at least one clear zone on both sides. A median designed with only a clear zone should be so wide that vehicles cannot end up on the opposite side of the road. However, such a width is hardly ever feasible in practice.

Do ‘cable barriers’ pose a risk to motorcyclists?

Shielding structures such as guard rails and 'cable barriers' aim to prevent serious head-on crashes and/or crashes with obstacles on the roadside. However, for motorcyclists, a shielding structure, regardless of type, can also be seen as an obstacle ([11]; see SWOV fact sheet Motorcyclists). Collisions with guard rails and other shielding structures account for 2-4% of fatal motorcycle crashes in Europe [25].

As cable barriers are more flexible than other types of barriers, the risk of serious injury for motor vehicles due to a crash with a cable barrier is lower than that due to a crash with, for example, a guard rail. Cable barriers therefore generally appear to be more effective in preventing serious crashes [26] [27] (see the question What does a safe verge (or outer verge) look like?). Although motorcyclists consider the cable barrier to be the most dangerous shielding structure [28], no evidence to this effect was found in several crash studies [27] [29] [30]. For motorcyclists, these studies found no difference between the risk of a serious crash with guard rails or with cable barriers.

Are trees along the road bad for road safety?

Over a quarter of (registered) road deaths in the Netherlands are due to run-off-road crashes (see the question How often do run-off-road crashes occur?). It can be deduced from crash registration BRON that half of the run-off-road crashes involve a crash with a tree. Trees within the clear zone are therefore considered road safety hazards.

A recurrent misconception is that trees close to the road reduce speed and could therefore benefit road safety [31]. However, crash research on roads with a speed limit of 80 km/h and higher (in the Netherlands and abroad) shows that obstacles close to the road, including trees, increase the risk of a serious crash by about a factor of one and a half to two [20]. This implies that (unshielded) trees within the clear zone, regardless of a possible limited restraining effect on driven speeds, significantly increase the risk of a serious run-off-road crash.

How to make roadsides safer?

The most important measures can be taken in the prescribed clear zone; see the question What does a safe roadside (or outer verge) look like? With obstacle removal or forgiving obstacle shielding in the prescribed clear zone, up to half of the casualties in run-off-road crashes can be prevented [8].

Also important are enhancing the load-bearing capacity of roadside and providing a semi-hardened shoulder next to the carriageway. This provides drivers with more control over their vehicles, allowing them to slow down their vehicles in a controlled manner and steer it back out of the roadside if necessary. Although effect estimates of these specific measures are lacking, US research shows that surfaced roadsides of 60 or 180 centimetres reduce crashes by up to 13% and 33%, respectively [32].

A third type of measure is a flexible shielding structure. This can be an alternative to removing obstacles, such as trees, from the prescribed clear zone. However, there must be sufficient space between the obstacles and the lane: it must be possible to position the shielding structure outside the recovery zone next to the road and at a sufficient distance from the obstacles (see the question What does a safe roadside (or outer verge) look like?). With a shielding structure, as with an clear zone, it is expected that up to half of the casualties in run-off-road crashes can be prevented [8].

According to Van Petegem et al [8] roadside safety can be further optimised by combining an clear zone with a shielding structure at a somewhat greater distance from the road, at the end of the clear zone.

On roads where neither the required clear zone nor a shielding structure is possible, lowering the speed limit is sometimes considered, for example from 80 to 60 km/h. This is because the required clear zone is smaller the slower the speed (see the question What does a safe roadside (or outer verge) look like?). However, lowering the speed limit will only lead to an improvement in road safety if the speeds driven actually drop to or below the new limit, and the measure does not lead to shortcuts via access roads. After all, access roads are not designed to handle larger traffic volumes, and on these roads vulnerable road users and motor vehicles mix.

Finally, inspection and maintenance are important for keeping roadsides safe, as is also shown by recent European research [33]. This is because a safely constructed roadside can become unsafe due to, for example, self-seeding of trees, subsidence of the roadside and corrosion of objects, making them no longer 'crashworthy'. In addition, if not adequately maintained, shielding structures may no longer function safely due to, for example, corrosion, subsidence of the roadside or previous crashes. After maintenance, it is important to check whether shielding structures in particular still meet the requirements.

How to make medians safer?

The purpose of the median is to physically separate driving directions to prevent head-on crashes, which is especially important at driving speeds above 70 km/h (see SWOV fact sheet Sustainable Road Safety). A large number of 80 or 100 km/h roads do not have medians; they would have to be constructed [32].

Medians can be made safer with a shielding structure (see the question What does a safe median look like?). Medians with a rigid shielding structure can be made safer by replacing the rigid shields with flexible shields (see the question What does a safe roadside (or outer verge) look like?). Widening the median generally makes it safer. It allows a greater distance of the shielding structure to the lane, reducing the risk of a crash in the median and providing a recovery zone for a vehicle with a breakdown. It also allows space for the larger working width of the flexible shielding structure. Finally, sufficient load-bearing capacity, inspection and maintenance are also important for keeping a median safe (see the question How to make roadsides safer?).

What other measures can be taken to prevent run-off-road crashes?

Infrastructure

Besides the design of the roadsides themselves, other infrastructural measures can be taken to help prevent run-off-road crashes.

In road design, it is important to avoid unexpectedly tight curves [23]. See the question What are the causes of run-off-road crashes? Widening excessively tight curves can substantially reduce the risk of a run-off-road crash. When the curve itself cannot be adjusted, it is important to alert drivers to the tight curve with appropriate marker posts [34], so that they can adjust their driving speed accordingly [35]. Crash studies do not say how many crashes can be prevented by marking curves.

According to international research [32], a wider cross section may also contribute to a reduction in the number of (run-off-road) crashes. This concerns the entire cross section, i.e. both a wider carriageway, lane and narrow paved shoulder, and wider driving direction separation than is common in the Netherlands. Indeed, compared to other European roads, Dutch roads are relatively narrow.

With vibration and sound, Rumble strips (transverse rumble strips) in the edge markings of medians or roadsides may alert drivers that they are in danger of leaving the lane, thus preventing (run-off-road) crashes [36] [37] [38] [39]. In the Netherlands, rumble strips are hardly applied because of noise pollution affecting the environment.

Vehicle systems

Vehicle safety systems can also help prevent crashes (see SWOV fact sheets Safe passenger cars and Intelligent transport- and advanced driver assistance systems (ITS and ADAS)).

Electronic stability control (ESC)
ESC (in combination with ABS) helps maintain vehicle stability and prevent skidding. According to international research [40] [41]. the system has a strong reducing effect on crashes. ESC has been mandatory in all new cars sold since 2014; it is estimated that about two-thirds of vehicles now have ESC [42].

Systems that monitor and/or correct the lateral position
Systems such as Lane Keeping Assist (LKA), Lane Departure Warning (LDW) and Lane Centering Assist (LCA) can warn and possibly intervene on their own if drivers gradually leave the lane and enter the roadside, for example due to distraction or fatigue [2] [43]. However, only little is known about the effectiveness of these systems in preventing (roadside) crashes and about their acceptance and use [43] [44] [45]. However, it is estimated that LDW can help prevent 10%-21% of crashes and LKA 20%-30% of crashes (including run-off-road crashes) due to gradually changing a vehicle’s direction [46].

Driver monitoring systems
Driver monitoring systems monitor whether the driver is still focused on the driving task. These types of systems monitor the driver for signals of fatigue and distraction, such as changes in driving style, especially steering behaviour [47], or the amount of time the driver's eyes are away from the road [48]. For signals of fatigue or distraction, the system can alert the driver with sound and/or haptic feedback. It is not yet known how effective these systems are in preventing crashes [47] [48].

New European motor vehicle regulations require both LKA and driver monitoring systems to be present in new vehicles from 2022 onwards (see the European Commission website). Incidentally, drivers are not obliged to turn on the systems.

Other measures

Finally, measures aimed at preventing unsafe behaviour that contributes to the occurrence or serious outcome of run-off-road crashes (see the section ‘human factors’ under the question What are the causes of run-off-road crashes?) may also help prevent run-off-road crashes. More specifically, these could include:

  • Measures to combat fatigue of professional drivers, such as legislation on driving times and rest periods, and attention to the topic among employers (see SWOV fact sheet Fatigue).
  • Enforcement, supported by publicity campaigns, on speed, use of alcohol and drugs, seatbelt use and phone use (see SWOV fact sheet Traffic enforcement).
Publications and sources

Below you will find the list of references that are used in this fact sheet; all sources can be consulted or retrieved. Via Publications you can find more literature on the subject of road safety.

[1]. Schepers, P. & Klein Wolt, K. (2012). Single-bicycle crash types and characteristics. In: Cycling Research International, vol. 2, p. 119-135.

[2]. Davidse, R.J. (2011). Bermongevallen: karakteristieken, ongevalsscenario's en mogelijke interventies. Resultaten van een dieptestudie naar bermongevallen op 60-, 70-, 80- en 100km/uur-wegen [Run-off-road crashes: characteristics, crash scenarios and possible interventions. Results of an in-depth study of run-off-road crashes on 60, 70, 80 and 100 km/h roads]. R-2011-24 [Summary in English]. SWOV, Leidschendam.

[3]. Davidse, R.J., Doumen, M.J.A., Duijvenvoorde, K. van & Louwerse, W.J.R. (2011). Bermongevallen in Zeeland: karakteristieken en oplossingsrichtingen. Resultaten van een dieptestudie [Run-off-road crashes in the Province of Zeeland: characteristics and possible solutions. Results of an in-depth study]. R-2011-20 [Summary in English]. SWOV, Leidschendam.

[4]. Louwerse, W.J.R., Davidse, R.J., Sluijs, L.C. van, Duivenvoorden, C.W.A.E., et al. (2012). Over bermen, bochten en bomen: verkeerstechnische resultaten van diepteonderzoek naar bermongevallen. Paper presented at Nationaal Verkeerskunde Congres, 31 oktober 2012, Brabanthallen, ’s-Hertogenbosch.

[5]. Davidse, R.J. (2012). Diepteonderzoek naar bermongevallen: Nieuwe inzichten en aanknopingspunten voor beleid. Proceedings of the Nationaal Verkeersveiligheidscongres NVVC. Verkeersveiligheid: Een gezamenlijke verantwoordelijkheid. ANWB/SWOV/VVN, Rotterdam.

[6]. Doecke, S.D. & Woolley, J.E. (2011). Further investigation into the effective use of clear zones and barriers in a safe system's context on rural roads. Paper presented at 2011 Australasian Road Safety Research, Policing and Education Conference, 6 - 9 November 2011, Perth, Western Australia.

[7]. Jamieson, N.J., Waibl, G. & Davies, R. (2013). Use of roadside barriers versus clear zones. NZ Transport Agency research report 517. Wellington.

[8]. Petegem, J.W.H. van, Louwerse, W.J.R. & Commandeur, J.J.F. (2017). Veilige bermen langs autosnelwegen: obstakelvrije zone, geleiderails of beide. R-2017-16. SWOV, Den Haag.

[9]. Schermers, G., Petegem, J.W.H. van, Hermens, F. & Hettema, Z.J.A. (2021). Beoordeling validatie prioriteiten risicolocaties bermen. Onderzoeksverantwoording. R-2021-6A. SWOV, Den Haag.

[10]. Stipdonk, H.L., Bijleveld, F.D., Davidse, R.J., Weijermars, W.A.M., et al. (2016). De stijging in het aantal verkeersdoden op rijkswegen in 2015. Statistische analyse, bestudering van ongevallen en verkenning van mogelijke verklarende factoren [The increase in the number of road deaths on national roads in 2015. Statistical analysis, examination of crashes and exploration of possible explanatory factors]. R-2016-9 [Summary in English]. SWOV, Den Haag.

[11]. Davidse, R.J., Louwerse, W.J.R. & Duijvenvoorde, K. van (2018). Dodelijke verkeersongevallen op rijkswegen in 2016. Analyse van ongevals- en letselfactoren en daaruit volgende aanknopingspunten voor maatregelen. R-2018-9. SWOV, Den Haag.

[12]. Davidse, R.J., Louwerse, W.J.R. & Duijvenvoorde, K. van (2019). Dodelijke verkeersongevallen op rijkswegen in 2017. Analyse van ongevals- en letselfactoren en daaruit volgende aanknopingspunten voor maatregelen. R-2019-8. SWOV, Den Haag.

[13]. Davidse, R.J., Duijvenvoorde, K. van & Louwerse, W.J.R. (2020). Dodelijke verkeersongevallen op rijkswegen in 2019. Analyse van ongevals- en letselfactoren en daaruit volgende aanknopingspunten voor maatregelen [Fatal road crashes on national roads in 2019. Analysis of crash and injury factors and resulting potential countermeasures]. R-2020-29 [Summary in English]. SWOV, Den Haag.

[14]. Davidse, R.J., Duijvenvoorde, K. van & Louwerse, W.J.R. (2020). Dodelijke verkeersongevallen op rijkswegen in 2018. Analyse van ongevals- en letselfactoren en daaruit volgende aanknopingspunten voor maatregelen [Fatal road crashes on national roads in 2018. Analysis of crash and injury factors and resulting potential countermeasures]. R-2020-26[Summary in English]. SWOV, Den Haag.

[15]. Davidse, R.J., Duijvenvoorde, K. van & Louwerse, W.J.R. (2021). Dodelijke verkeersongevallen op rijkswegen in 2020. Analyse van ongevals- en letselfactoren en daaruit volgende aanknopingspunten voor maatregelen [Fatal road crashes on national roads in 2020. Analysis of crash and injury factors and resulting potential countermeasures]. R-2021-23 [Summary in English]. SWOV, Den Haag.

[16]. Davidse, R.J., Boele-Vos, M.J., Doumen, M.J.A., Duijvenvoorde, K. van, et al. (2021). Dodelijke verkeersongevallen in Noord-Brabant 2018-2019. Analyse van ongevals- en letselfactoren en daaruit volgende aanknopingspunten voor maatregelen [Fatal road crashes in the Dutch province of Noord-Brabant 2018-2019. Analysis of road crash and injury factors and resulting potential measures]. R-2021-9 [Summary in English]. SWOV, Den Haag.

[17]. Cheng, G., Cheng, R., Pei, Y. & Han, J. (2021). Research on highway roadside safety. In: Journal of Advanced Transportation, vol. 2021.

[18]. Aarts, L.T., Broek, L.J. van den, Oude Mulders, J., Decae, R.J., et al. (2022). De Staat van de Verkeersveiligheid 2022. Trend in aantal verkeersdoden en -gewonden daalt niet. R-2022-10. SWOV, Den Haag.

[19]. Hengeveld, J. & Nägele, R. (2014). De risico's van bermongevallen in samenhang met de berminrichting [confidential]. Ministerie van Infrastructuur en Milieu - Water, verkeer en leefomgeving.

[20]. Petegem, J.W.H. van, Louwerse, W.J.R. & Commandeur, J.J.F. (2017). Berminrichting langs autosnelwegen. Literatuurstudie en advies voor vergevingsgezinde bermen [Layout of roadsides along motorways. Literature study and advice for forgiving roadsides]. R-2017-16A [Summary in English]. SWOV, Den Haag.

[21]. Goldenbeld, C., Schermers, G. & Petegem, J.W.H. van (2017). Low curve radius. European Road Safety Decision Support System, developed by the H2020 project SafetyCube. Accessed on 18-10-2022 at www.roadsafety-dss.eu.

[22]. Elvik, R. (2013). International transferability of accident modification functions for horizontal curves. In: Accident Analysis & Prevention, vol. 59, p. 487-496.

[23]. Lamm, R., Psarianos, B. & Mailaender, T. (1999). Highway design and traffic safety engineering handbook. McGraw-Hill, New York.

[24]. CROW (2013). Handboek wegontwerp 2013: Gebiedsontsluitingswegen. Publicatie 330. CROW, Ede.

[25]. OECD/ITF (2015). Improving safety for motorcycle, scooter and moped riders. OECD Publishing, Paris.

[26]. Hu, W. & Donnell, E.T. (2010). Median barrier crash severity: Some new insights. In: Accident Analysis & Prevention, vol. 42, nr. 6, p. 1697-1704.

[27]. Zou, Y., Tarko, A.P., Chen, E. & Romero, M.A. (2014). Effectiveness of cable barriers, guardrails, and concrete barrier walls in reducing the risk of injury. In: Accident Analysis & Prevention, vol. 72, p. 55-65.

[28]. Nombela, M., Davila, A., Alba, J.J. & de Miguel, J.L. (2010). Innovative concepts for Smart Road Restraint Systems to provide greater safety for vulnerable users - Smart RRS. Technical paper, SAE International.

[29]. Daniello, A. & Gabler, H.C. (2011). Effect of barrier type on injury severity in motorcycle-to-barrier collisions in North Carolina, Texas, and New Jersey. In: Transportation Research Record, vol. 2262, nr. 1, p. 144-151.

[30]. Rizzi, M., Strandroth, J., Sternlund, S., Tingvall, C., et al. (2012). Motorcycle crashes into road barriers: the role of stability and different types of barriers for injury outcome. In: Proceedings of the 2012 IRCOBI Conference. Paper IRC-12-41 328-341.

[31]. Schut, M. (2021). Nog veel ongelukken door bomen in de berm. KRO-NCRV - Pointer. Accessed on 01-05-2022 at pointer.kro-ncrv.nl/nog-veel-ongelukken-door-bomen-in-de-berm.

[32]. Schermers, G. & Petegem, J.W.H. van (2013). Veiligheidseisen aan het dwarsprofiel van gebiedsontsluitingswegen met limiet 80 km/uur. Aanbevelingen voor de actualisatie van het Handboek Wegontwerp [Safety requirements for the cross sectional profile of distributor roads with an 80 km/h speed limit. Recommendations for the update of the Handbook Road Design]. D-2013-2[Summary in English]. SWOV, Leidschendam.

[33]. Weber, R., Schermers, G., Petegem, J.H. van, Cardoso, J., et al. (2019). PROGReSS (Provision of Guidelines for Road Side Safety) - Road side safety elements: state of the art report. WP 5 Quality management and final report, Deliverable 5.1. CEDR Transnational Road Research Programme: Call Safety, 2016.

[34]. CROW (2015). Richtlijnen voor de bebakening en markering van wegen. Publicatie 207. CROW, Ede.

[35]. SWOV (2002). Safety Standards for Road Design and Redesign SAFESTAR. Deliverable D9.2: final report. SWOV, Leidschendam.

[36]. Turner, S., Dixon, A. & Wood, G. (2004). Assessing the crash risk implications of roadside hazards.

[37]. Torbic, D.J., Hutton, J.M., Bokenkroger, C.D., Bauer, K.M., et al. (2009). Guidance for the design and application of shoulder and centerline rumble strips. NCHRP 641. Transportation Research Board.

[38]. Noella, K. (2017). Implementation of rumble strips at centreline. European Road Safety Decision Support System, developed by the H2020 project SafetyCube. Accessed on 20-10-2022 at www.roadsafety-dss.eu.

[39]. Vadeby, A. & Anund, A. (2017). Effectiveness and acceptability of milled rumble strips on rural two-lane roads in Sweden. In: European Transport Research Review, vol. 9, nr. 2, p. 29.

[40]. Phan, V. (2017). Electronic Stability Control (ESC). European Road Safety Decision Support System. developed by the H2020 project SafetyCube. Accessed on 03-11-2022 at www.roadsafety-dss.eu.

[41]. Høye, A. (2011). The effects of Electronic Stability Control (ESC) on crashes—An update. In: Accident Analysis & Prevention, vol. 43, nr. 3, p. 1148-1159.

[42]. Weijermars, W.A.M., Stipdonk, H.L., Dijkstra, A., Bijleveld, F.D., et al. (2018). Verkeersveiligheidsprognoses 2030. Geschat aantal verkeersdoden en ernstig verkeersgewonden zónder Strategisch Plan Verkeersveiligheid 2030. R-2018-17A. SWOV, Den Haag.

[43]. Grover, C., Avery, M. & Knight, I. (2015). Technologies for the prevention of run off road and low overlap head-on collisions. Proceedings of the 24th Enchanced Safety of Vehicles Conference. NHTSA, Gothenburg, Zweden.

[44]. Jänsch, M. (2017). Lane keeping systems. European Road Safety Decision Support System, developed by the H2020 project SafetyCube. Accessed on 11-12-2018 at www.roadsafety-dss.eu.

[45]. Katteler, H. (2003). Acceptance of Lane Departure Warning Assistance (LDWA) systems: Final report. TM-03-C022. TNO, Soesterberg.

[46]. Cleij, D. (2021). Road safety thematic report – Advanced driver assistance systems. European Road Safety Observatory, European Commission, Brussels.

[47]. EC (2021). Road safety thematic report - Fatigue. European Road Safety Observatory. European Commission, Directorate General for Transport., Brussels.

[48]. EC (2022). Road safety thematic report – Driver distraction. European Road Safety Observatory. European Commission, Directorate General for Transport, Brussels.

6 + 7 =
Solve this simple math problem and enter the result. E.g. for 1+3, enter 4.

Would you like to cite this fact sheet?

SWOV publication

This is a publication by SWOV, or that SWOV has contributed to.